Stock Market Commentary:
The stock market has swung so much between hope and despair that it looks like a dog chasing its tail down a hill. Accordingly, “The Market Breadth” has careened from soaring headlines to danger signs. A steep downtrend has remained in place since the last peak in August. Since that time 200-day moving average (DMA) has held as resistance across the major indices. The 20DMA took over from there as stiff resistance. That downtrend is the most salient technical feature of this market. Thus, a standing question for traders is how much longer can this resistance keep a lid on the market’s bounces out of oversold trading conditions? On Friday, news that both 1-year and 5-year inflation expectations increased (imagine that) helped to reinforce the brick wall of 20DMA resistance. Full steam ahead for the Fed and interest rates.
The Stock Market Indices
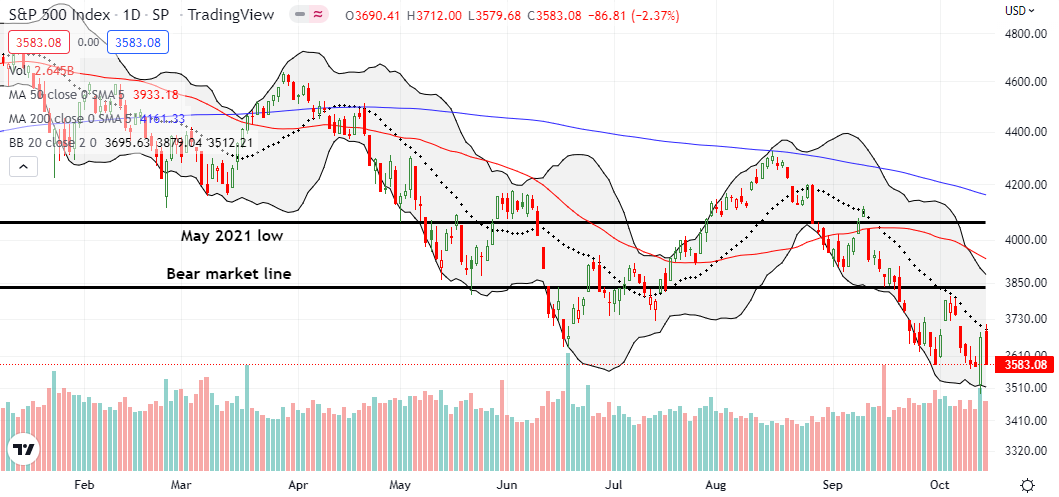
The S&P 500 (SPY) gapped up and opened right on top of its 20DMA (the dotted line below). After nudging a little higher, sellers took over for the rest of the day. The resulting 2.4% loss confirmed 20DMA resistance and closed the index right at the September closing low. The S&P 500 sits at the razor’s edge of a 2-year low. The index is almost set to resume a path toward reversing the rest of its pandemic-era gains. Thursday’s bullish engulfing pattern is wavering support sitting between here and the S&P 500’s pre-pandemic high of 3386.15.
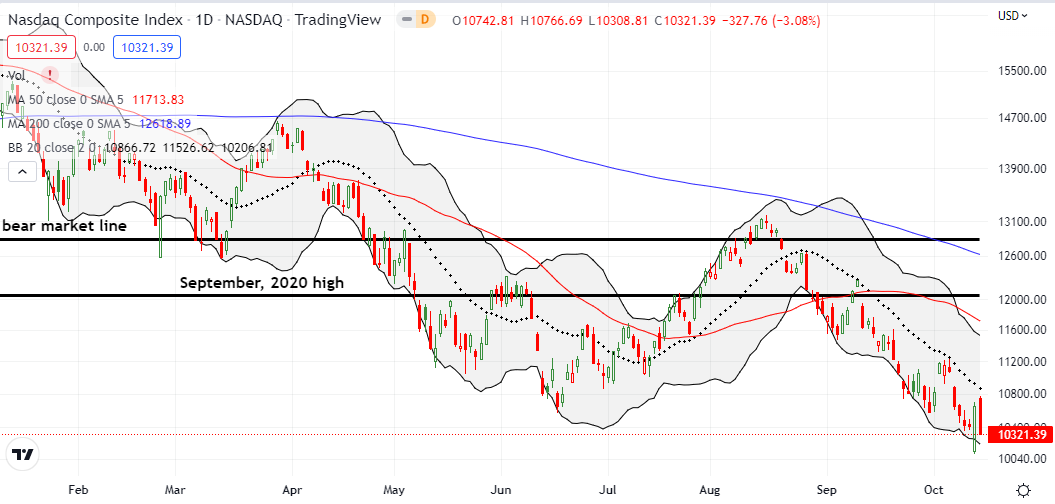
The NASDAQ (COMPQ) needs all the support it can get. The September lows are already a fading memory. The tech-laden index’s open failed to tag 20DMA resistance before sellers took over. This latest tail chasing took the NASDAQ down to a new 27-month closing low. The low of Thursday’s bullish engulfing pattern sits about 3% above the pre-pandemic high of 9817.18. Needless to say, I am still holding an October QQQ put option. The short side of the calendar spread expired on Friday.
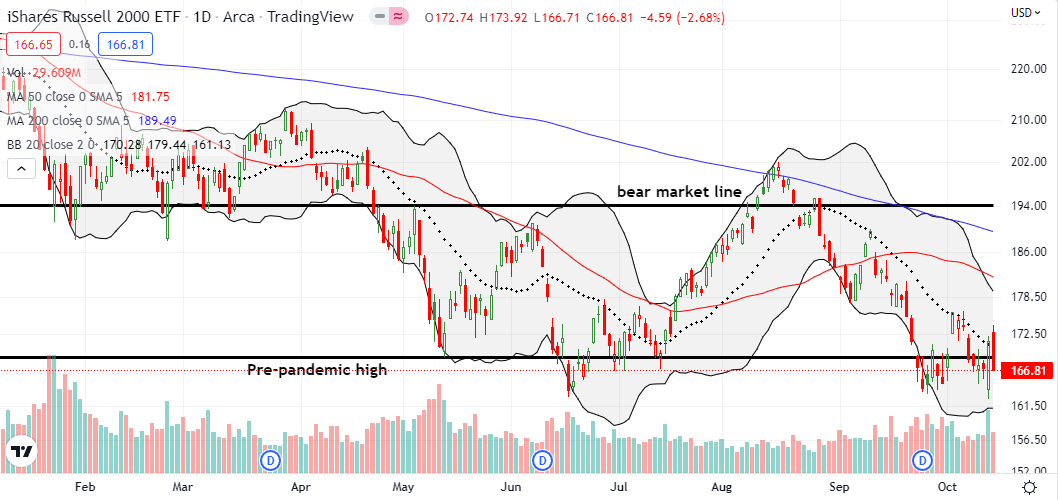
The iShares Russell 2000 ETF (IWM) still looks like it has a firm grip on support from the June and September lows. Moreover, IWM even managed to gap above its 20DMA. At that point, I took profits on half my IWM call positioning. The subsequent 2.7% loss was too much to resist, and I broke my plan to avoid buying anything on the day. I jumped into a fresh IWM calendar call spread. As a reminder, I prefer these spreads during times of high volatility because I can profit from on-going churn without paying high premiums.
Stock Market Volatility
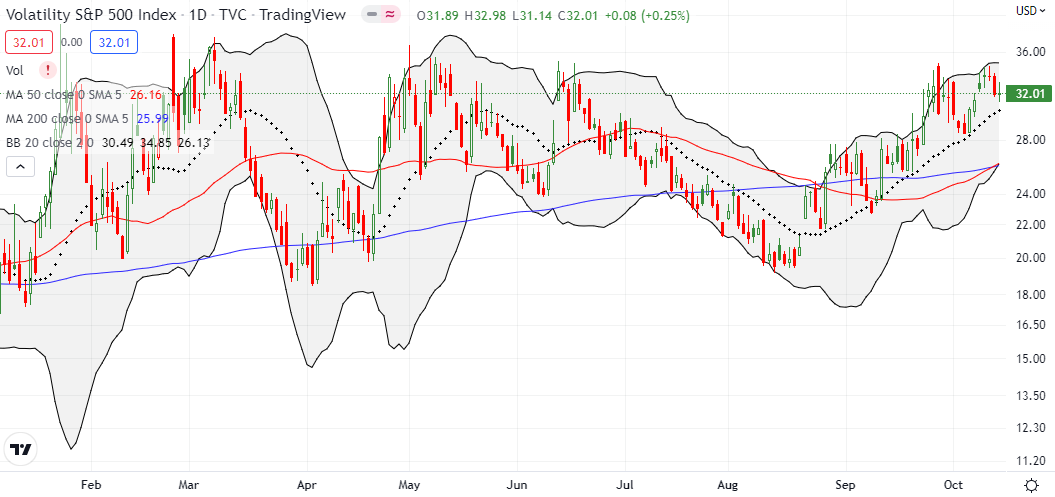
I give up trying to understand what the volatility index (VIX) is telling us. Despite the day’s awful reversals, the VIX essentially closed FLAT on the day. Moreover, faders even succeeded in taking the VIX off its intraday high. Until the VIX either surges to new highs and/or plunges through the bottom of its uptrend channel, I am treating the VIX as a signal in limbo.
The Short-Term Trading Call With the Market Chasing Its Tail
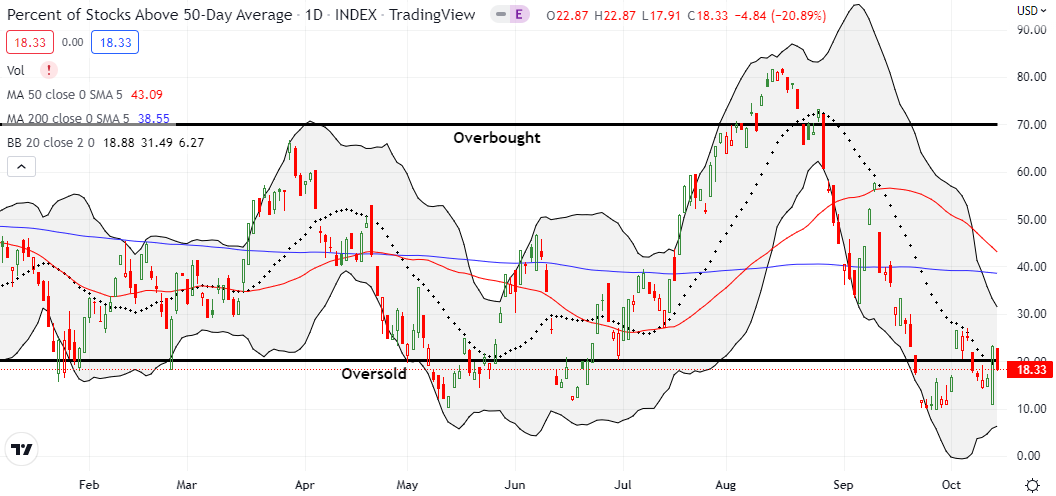
- AT50 (MMFI) = 18.3% of stocks are trading above their respective 50-day moving averages (day #1 of a new oversold period)
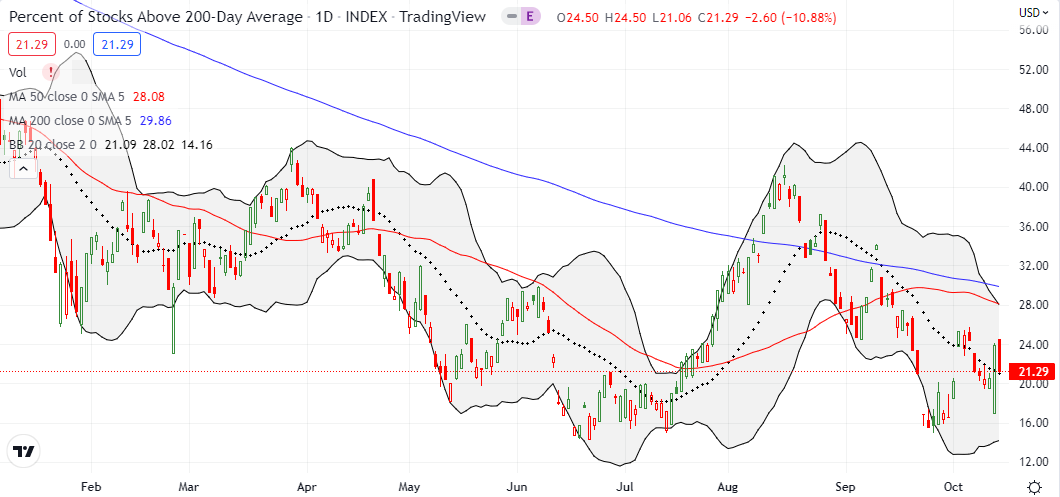
- AT200 (MMTH) = 21.3% of stocks are trading above their respective 200-day moving averages
- Short-term Trading Call: cautiously bullish
AT50 (MMFI), the percentage of stocks trading above their respective 50DMAs, dropped right back into oversold trading conditions with its close below 20%. As planned, I downgraded my short-term trading call from bullish to cautiously bullish. This downgrade runs counter to my AT50 trading rules, but these are atypical times. Persistently elevated inflation and an aggressively hawkish Fed create trading conditions that are new to the AT50 trading model. Typically, I upgrade my short-term trading call with the start of oversold trading. However, THIS time the day’s sharp reversal threatens to invalidate the prior bullish engulfing trading signal; this action forced my hand. I will drop the “cautiously” modifier upon deep oversold conditions or a convincing end to the 20DMA downtrend. A breach of the intraday low on the bullish engulfing candle would open a trap door for deeply oversold trading conditions.
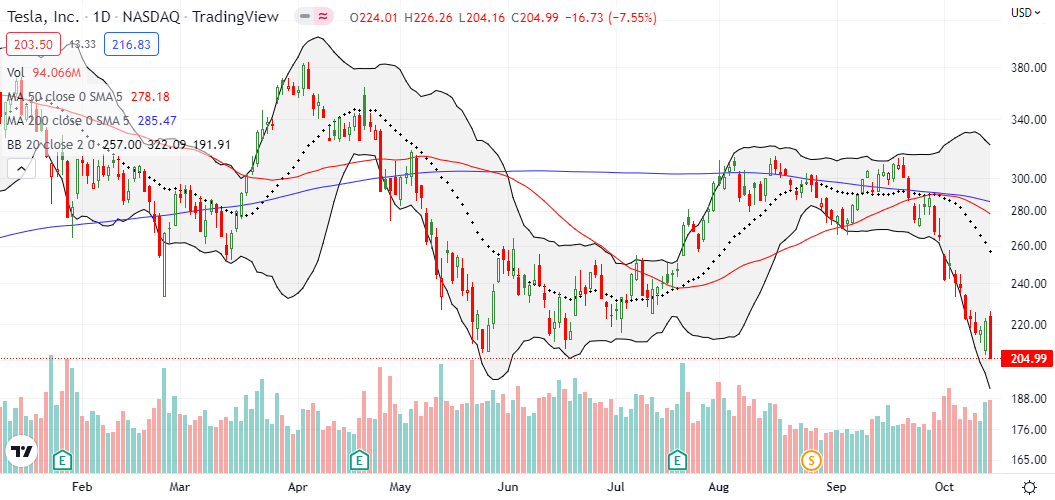
Tesla, Inc (TSLA) is a dramatic example of what an invalidation looks like for a bullish engulfing candle. Sellers answered buyers with a bearish engulfing candle. The resulting 7.6% loss took TSLA to a 16-month low. An even bigger implication is that TSLA’s breach threatens several ARK Innovation funds with lows few could have thought possible even just a few months ago. For example, the ARK Innovation ETF (ARKK) finally closed BELOW its pandemic low and now sits at a FIVE-YEAR closing low. TSLA is ARKK’s largest holding with a 10.3% share.
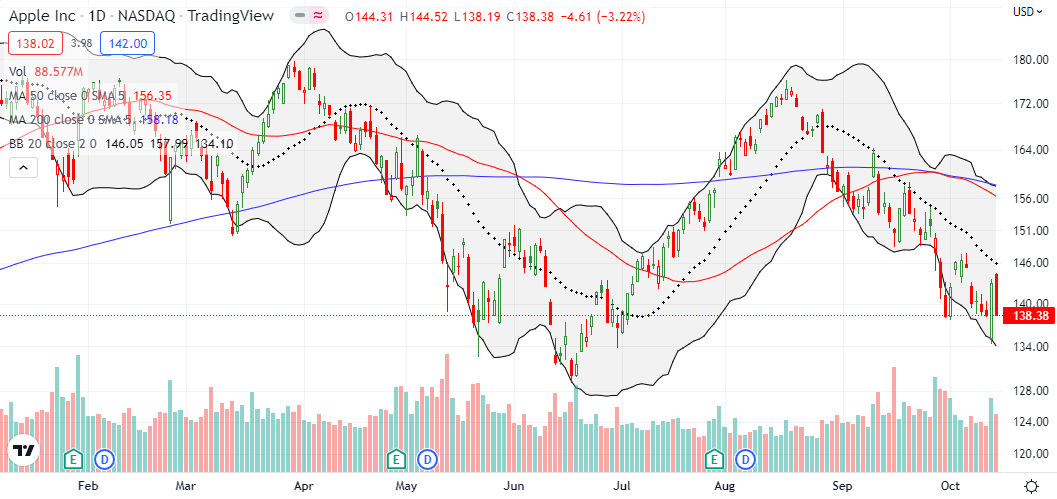
Apple Inc (APPL) put on a fresh display of symmetry in another demonstration of how technicals can dominate even America’s favorite stock. AAPL lost 3.2% and closed exactly flat with its September low. Apple closed at or bounced from this low all week, except for Thursday’s surge. All this action is happening just below Apple’s key October 2021 low of $139.05. Note even the mighty AAPL has been unable to crack 20DMA resistance for two months.
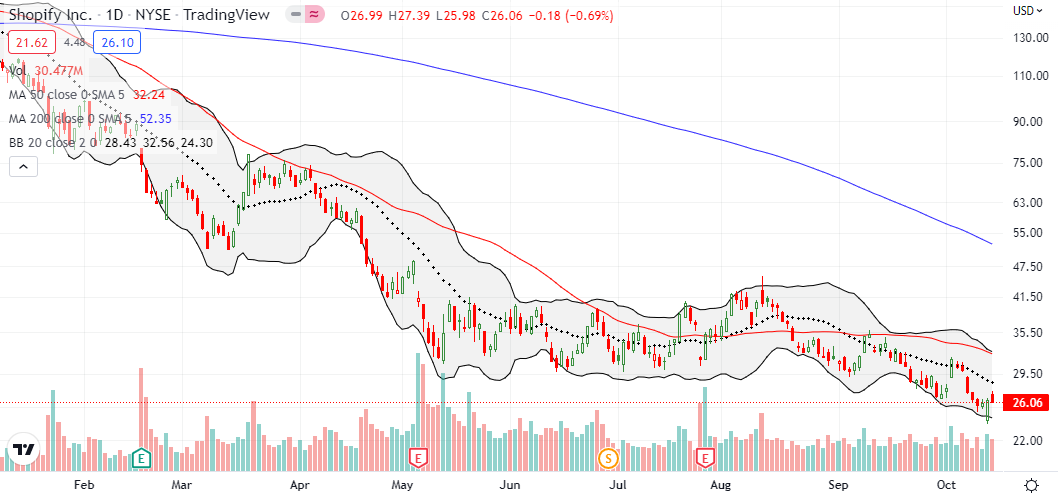
Since the May low, Shopify (SHOP) looked like it was forming a solid base. Trading over the last month broke through the bottom of that base. If Thursday’s bullish engulfing fails to hold as new support, SHOP faces new 3 1/2 year lows and worse. Like ARKK, these are levels few could have imagined earlier this year. SHOP was one of several key pandemic era darlings. Now the stock trades with an 85% loss from its all-time high.
Be careful out there!
Footnotes
“Above the 50” (AT50) uses the percentage of stocks trading above their respective 50-day moving averages (DMAs) to measure breadth in the stock market. Breadth defines the distribution of participation in a rally or sell-off. As a result, AT50 identifies extremes in market sentiment that are likely to reverse. Above the 50 is my alternative name for “MMFI” which is a symbol TradingView.com and other chart vendors use for this breadth indicator. Learn more about AT50 on my Market Breadth Resource Page. AT200, or MMTH, measures the percentage of stocks trading above their respective 200DMAs.
Active AT50 (MMFI) periods: Day #1 under 20% (1st day oversold ending 1 day over 20%), Day #19 under 30%, Day #24 under 40%, Day #26 under 50%, Day #34 under 60%, Day #35 under 70%
Source for charts unless otherwise noted: TradingView.com
Full disclosure: long QQQ put, long IWM call and calendar call spread, short SPY put spread, long ARKK shares, long ARKK calendar put spread
FOLLOW Dr. Duru’s commentary on financial markets via StockTwits, Twitter, and even Instagram!
*Charting notes: Stock prices are not adjusted for dividends. Candlestick charts use hollow bodies: open candles indicate a close higher than the open, filled candles indicate an open higher than the close.


curious how you structured your IWM calendar call spreads?
PM
IWM $170 Oct 21/Oct 28 calendar call spread. Note I also have a waning IWM $175 Oct 21 call that is the surviving long side of an earlier calendar call spread at $175.
In other words, if IWM manages to soar this week, I won’t make much, if anything, on the call spread, but I still have the $175 call to collect on.
looking at daily chart from 2007 look eerily similar…..took two tries to finally punch through the 200dSMA, then up to 50 dSMA and bounce down, then up to 200 dSMA and bounce down (with a few bounces of 20 dSMA), followed lastly by a move up to 50dSMA and eventually big break down. The mood on Fast money and overtime was bear market really. PLus AT50 low for last two weeks. Seems ripe for a move up to 50 dSMA…..well until the fed meeting comes out again….Ha
Well the great financial crisis was our last real bear market (19% and 20% declines after that were extremely brief – thank you, Fed!) so a close pattern perhaps makes sense. But as I like to say, one step at a time.
I wonder whether a rally going into the Fed meeting will embolden the Fed to keep talk just as tough as ever.
For last several months they have walked the party line together…..4.5-4.75% by next march before pausing. two half point raises then 2 quarter point raises gets you there. Market may determine if they go .75 (market is up) or .5 (market is flat or down) at next meeting.n Guess we will see….
These are times where regular check-ins on the CME FedWatch tool keeps us well-informed on market opinions on rates and Fed action.