Housing Market Intro and Summary
Talk of an imminent recession has almost reached a feverish pitch. Accordingly, it is easy to find fears and expectations for an imminent housing crash. The crash watch is morbid as it relies on desperate home owners falling behind on mortgage payments and/or burdened by sinking equity to exit the market at discount rates. Yet, the “disaster” to come may disappoint crash-watchers as the finances of today’s home owners are much better than in previous economic downturns. The Great Financial Crisis disciplined financial institutions so much that mortgages were mostly limited to highly qualified buyers. The strong jobs report for July also suggests that the housing market will avoid a collapse. As employment goes, so goes the housing market. Moreover, recent congressional cooperation on the “Inflation Reduction Act” portends well for Federal support for the economy.
In my last Housing Market Review, I anchored on the theme of eyeing a floor for the housing market based on the behavior of the stocks of home builders. These stocks have remained resilient through the economic fears. Now, I am thinking about building from the bottom with just 2-3 months to go before the seasonally strong period for these stocks begins.
Housing Stocks
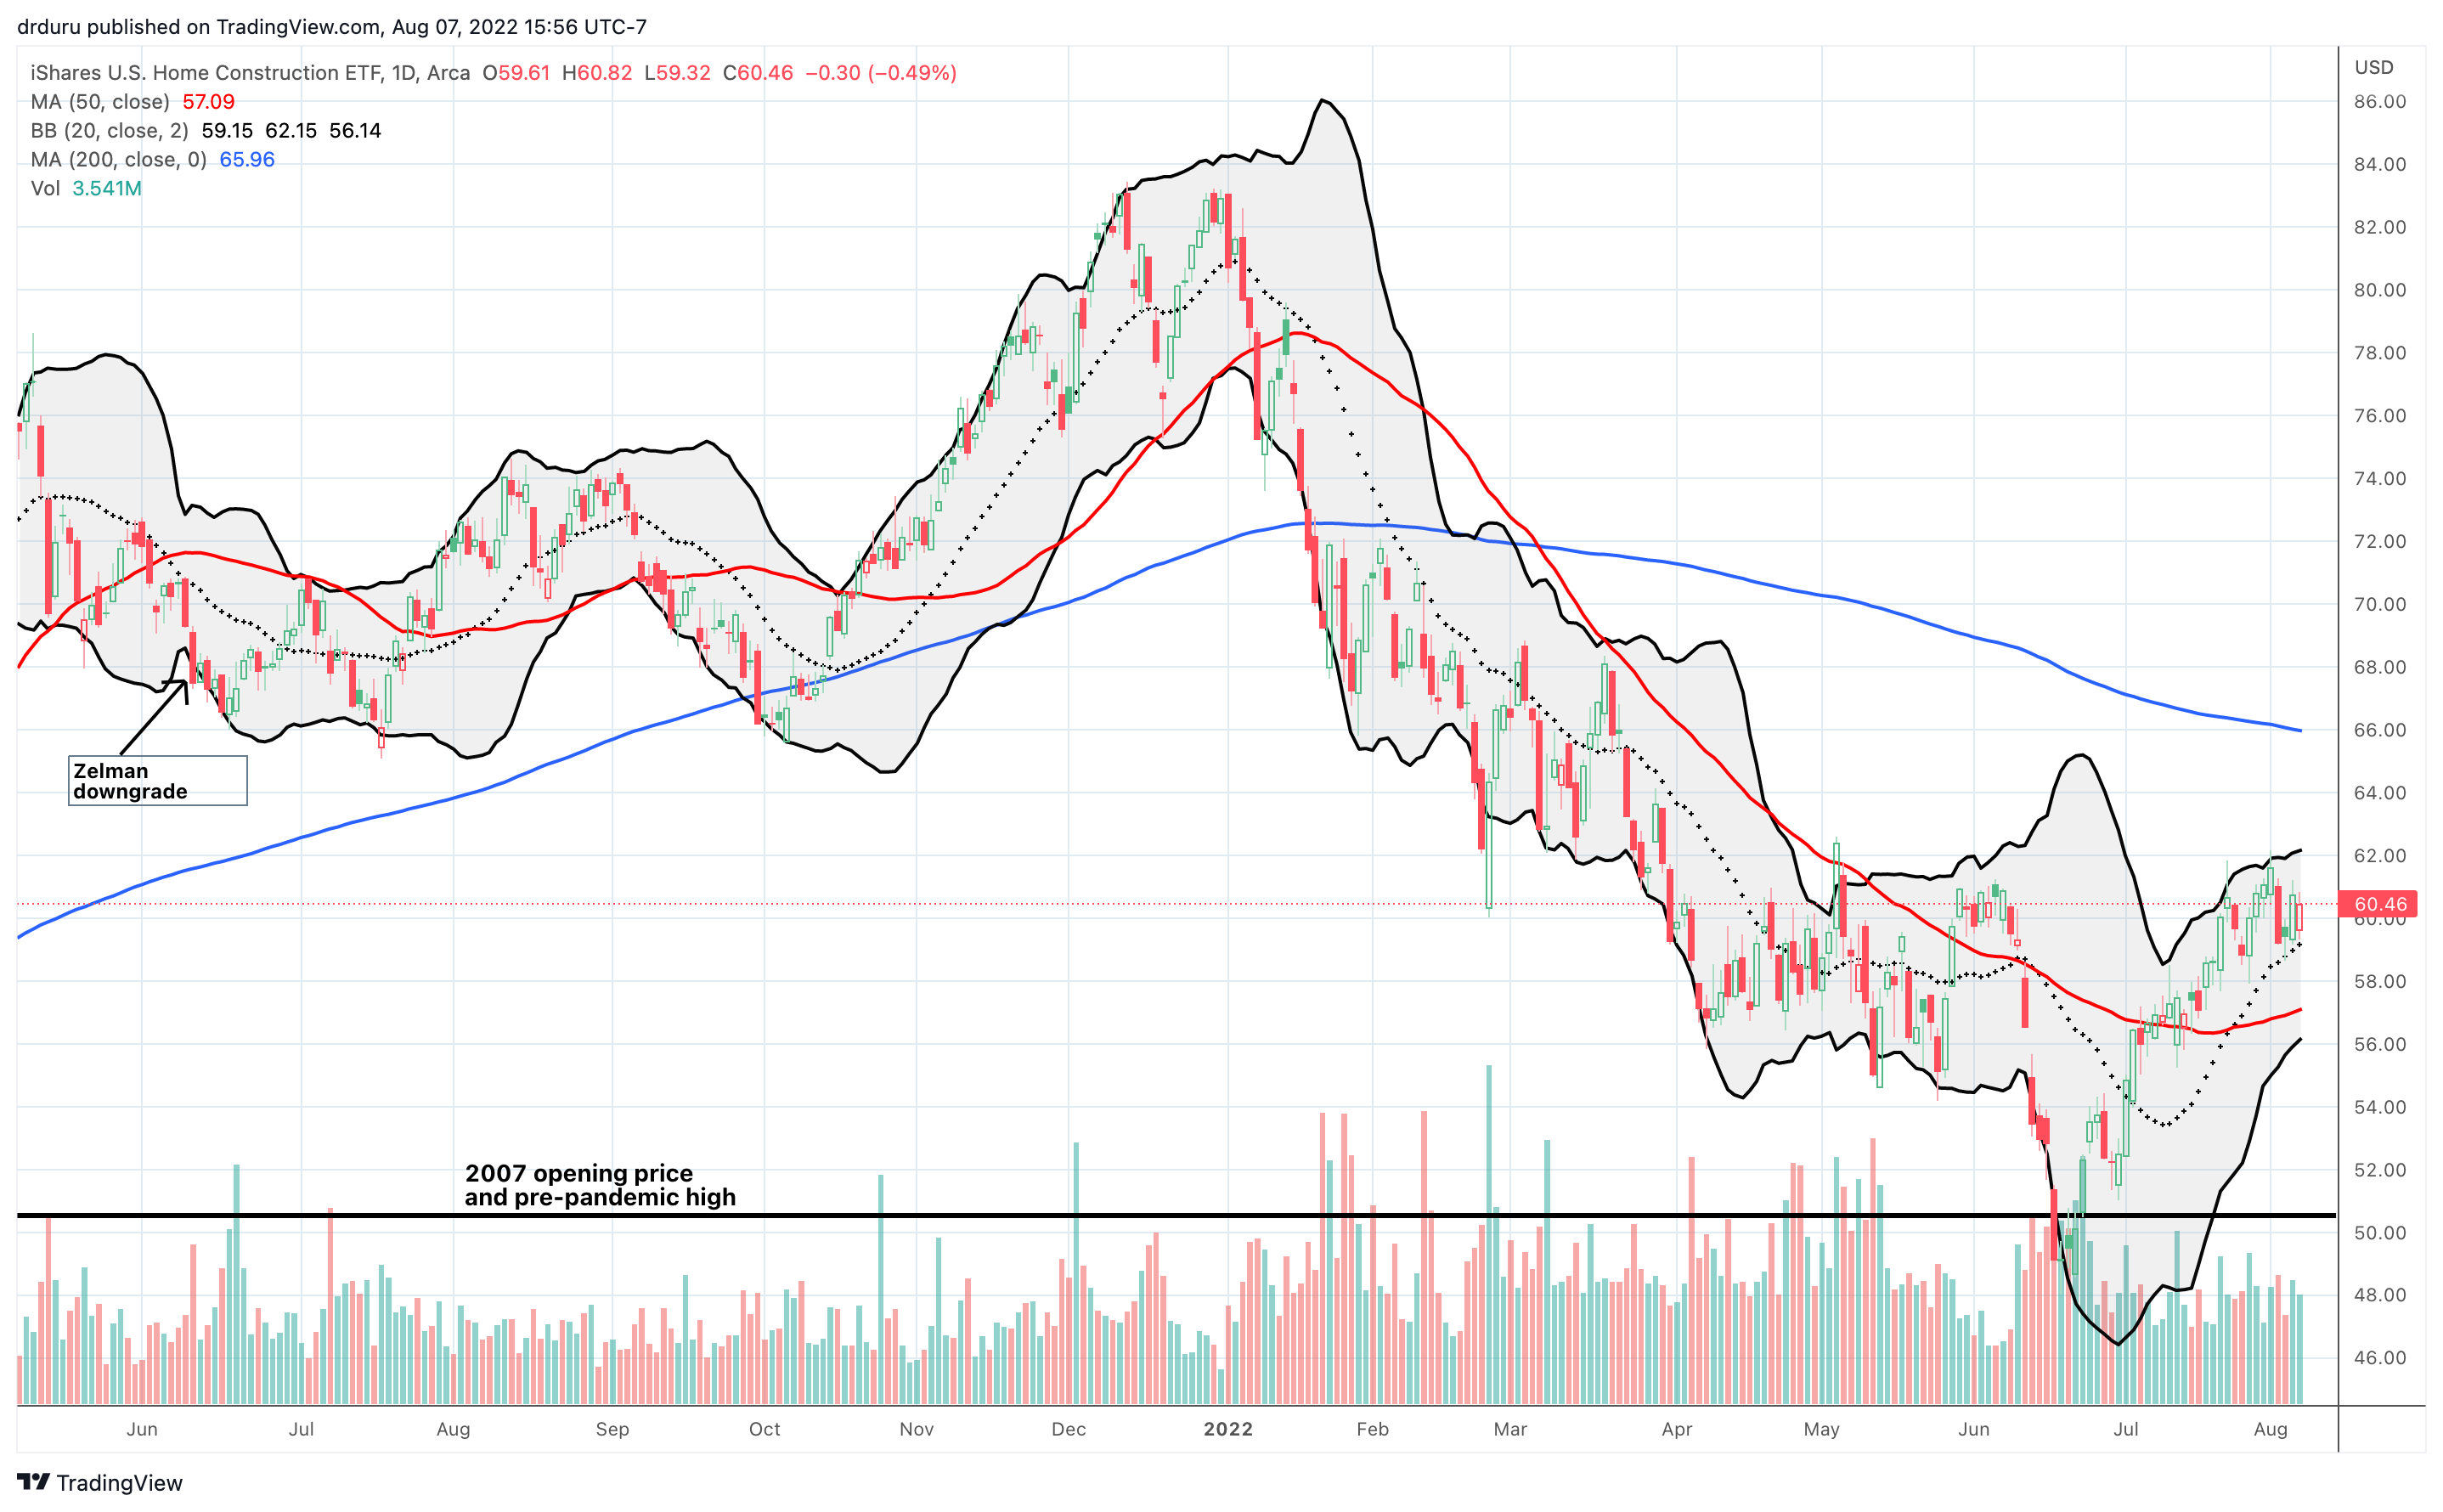
In July, the iShares US Home Construction ETF (ITB) continued building from the bottom. ITB soared 16.3% for the month, well ahead of the 9.1% gain in the S&P 500 (SPY). With ITB comfortably above its 50-day moving average (DMA) (the red line below), the technical picture for the ETF of home building stocks looks much improved since the June lows. This investor confidence translates into a better outlook for the housing market for now as a process of building from the bottom appears to be underway.

Housing Data
New Residential Construction (Single-Family Housing Starts) – June, 2022
The 1M mark is suddenly in jeopardy as a floor for housing starts. Housing starts fell below the pre-pandemic peak for the first time since the early days of the pandemic.
Starts decreased 8.1% from May to June’s 982,000 and decreased 15.7% year-over-year. May’s starts were revised upward to 1,068,000. Starts are still in a steep decline, so breaking the 1 million mark signifies a much lower likelihood of settling into a range. A breakdown lower would signal a further contraction in expectations for future sales and a new potential floor of 800K for starts.
![Housing starts Source: US. Bureau of the Census, Privately Owned Housing Starts: 1-Unit Structures [HOUST1F], first retrieved from FRED, Federal Reserve Bank of St. Louis, August 1, 2022.](https://drduru.com/onetwentytwo/wp-content/uploads/2022/07/220801_Housing-Starts.png)
The Midwest was the only region where starts gained ground. The South was finally not the region with the biggest decline. Housing starts in the Northeast, Midwest, South, and West each changed -40.7%, +13.1%, -9.9%, and -4.9% respectively year-over-year.
Existing Home Sales – June, 2022
In June, the inventory of existing homes finally fell year-over-year in tandem with sales. Until then, you could conclude that the market for existing homes was nearly as tight as ever. The streak in year-over-year declines in inventory ended at 37 months.
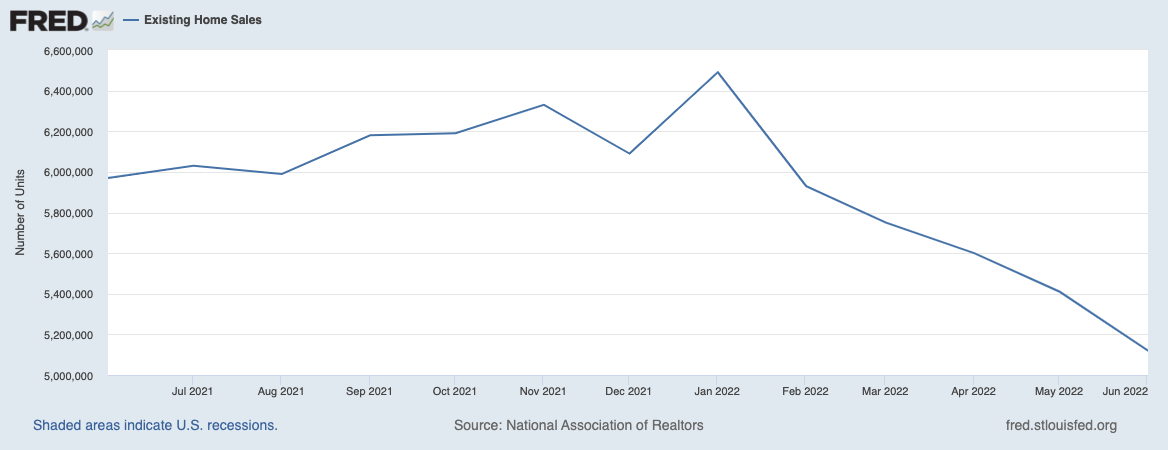
In the previous two reports, the National Association of Realtors (NAR) predicted more weakness for sales. In this latest report, there was no need to do so. Instead the NAR somberly noted that “Falling housing affordability continues to take a toll on potential home buyers…Both mortgage rates and home prices have risen too sharply in a short span of time.” Existing home sales dropped for a fifth month in a row. The seasonally adjusted annualized sales in June of 5.12M decreased 5.4% month-over-month from the unrevised 5.41M in existing sales for May. Year-over-year sales decreased 14.2%. For reference, pre-pandemic home sales activity was 5.0M to 5.5M in 2019. The market for existing home sales has normalized from the pandemic era mania. A drop below 2019 levels would signal a more significant slowdown.
(For historical data from 1999 to 2014, click here. For historical data from 2014 to 2018, click here) Source for chart: National Association of Realtors, Existing Home Sales© [EXHOSLUSM495S], retrieved from FRED, Federal Reserve Bank of St. Louis, August 1, 2022.

June’s absolute inventory level of 1.26M homes increased 9.6% from May, marking five straight monthly increases. The sequential increases have been steep enough to finally push inventory up year-over-year for the first time in 38 months. Inventory increased 2.4% year-over-year (compare to May’s 4.1%, April’s 10.4%, March’s 9.5%, February’s 15.5%, January’s 16.5%, December’s 14.2%, November’s 13.3%, October’s 12.0%, September’s 13.0%, and August’s 13.4% year-over-year unrevised declines). According to the NAR, “unsold inventory sits at a 3.0-month supply at the current sales pace, up from 2.6 months in May and 2.5 months in June 2021.” Inventory levels are still relatively tight. Normalized inventory will be around 6 months of sales.
Once again, the increase in absolute inventories did not impact the time it took for buyers to take a home off the market. The average 14 days it took to sell a home in June was down from 16 in the prior month and 17 a year ago. This rapid turnover demonstrates the strength of market demand among those who can still afford a home. The decline also confounded the NAR: “Finally, there are more homes on the market…the record-low pace of days on market implies a fuzzier picture on home prices.”
The increase in absolute inventory also did not slow down the linear march higher in prices. The median price of an existing home increased 1.9% from May to $416,600, another all-time high, and soared 13.4% year-over-year. Prices have increased year-over-year for 124 straight months, an on-going record streak.
The soaring cost of a home did not deter first-time buyers in June. They increased their share of sales from 27% in May to 30% in June. This rate is down from 31% a year ago so perhaps the increase in share is more about seasonality. The NAR’s 2017 Profile of Home Buyers and Sellers reported an average of 34% for 2017, 33% for 2018, 33% for 2019, 31% for 2020, and 34% for 2021.
All regions declined significantly in sales year-over-year, especially the West. The regional year-over-year changes were: Northeast -11.8%, Midwest -9.6%, South -14.1%, West -21.3%.
For the ninth month in a row, the South’s median price soared year-over-year. The South has outpaced the other three regions 10 months in a row. I imagine the rush for more attractive and affordable housing in the South is continuing to apply the stronger price pressures. The regional year-over-year price gains were as follows: Northeast +10.1%, Midwest +10.2%, South +16.8%, West +9.6%.
Single-family home sales decreased 4.8% from May and declined on a yearly basis by 12.8%. The median price of $423,300 was up 13.3% year-over-year.
California Existing Home Sales – June, 2022
California’s housing market provides a good example of the ironic way in which the Fed’s rate hikes to fight inflation have made housing less affordable. The slowing market forced the California Association of Realtors (C.A.R.) to revise its 2022 forecast originally set last October. While the C.A.R. took down their sales projection from 416,810 to 380,630, the group increased its projection of the median price from $834,440 to $863,390. In other words, a market slowdown is increasing unit choice but not broadening availability for the budget. At least bidding wars are likely moderating a bit with C.A.R.’s statewide sales-price-to-list-price ratio falling to 101.3% from 103.4% in May and 104.1% a year ago.
Choice rapidly expanded in June as total active listings rose to its highest point in almost 3 years. Active listings also ballooned higher by 64.4% year-over-year, which C.A.R. reported as the largest growth in over 7 years. A combination of increasing supply and dropping demand took the statewide unsold inventory index (UII) to a 2-year high. C.A.R. reported that “existing, single-family home sales totaled 344,970 in June on a seasonally adjusted annualized rate, down 8.4 percent from May and down 20.9 percent from June 2021.”
While the median price increased 5.4% year-over-year, it dropped 4.0% from June’s record high. C.A.R. suspects prices have peaked in most California counties. Higher-end homes led the way down in June. Homes priced at least $2M declined in sales by 17.9% from May. Meanwhile, homes priced below $500K increased in sales 2.1% from May. Californians are still shopping for homes but going down the price scale.
This swirl of data has pressured sentiment in California’s housing market. C.A.R.’s monthly Consumer Housing Sentiment Index showed in June that 79% of respondents “believed that the overall economic conditions in California will not improve in the next 12 months.” Moreover, only 14% believe that now is a good time to buy a home. Only 19% believed so a year ago.
New Residential Sales (Single-Family) – June, 2022
As expected, the increase in new home sales in May proved to be ephemeral. For June, new home sales fell to levels last seen at the trough of the pandemic. New home sales of 590,000 were down 8.1% from May’s 642,000 (revised down). Sales were down a whopping 17.4% year-over-year. Like existing home sales, the market for new homes has normalized. However, a drop below around the 550,000 level would take the market past the 2018-2019 pre-pandemic market and into a deeper slowdown. Again, given the resilience in home builder stocks, it is clear investors are not anticipating such a drop.
![new home sales Source: US. Bureau of the Census, New One Family Houses Sold: United States [HSN1F], first retrieved from FRED, Federal Reserve Bank of St. Louis, August 4, 2022](https://drduru.com/onetwentytwo/wp-content/uploads/2022/07/220804_New-Home-Sales.png)
The fresh decline in sales was led by a plunge in high-end homes, every tier above $400,000. The highest tier plunged 75% month-over-month and dropped from a 14% share of sales to 5%. The $300,000 to $399,999 price tier gained the bulk of the share and helped push the median home price further off its all-time high. The median price fell 9.5% month-over-month and still jumped 7.4% year-over-year.
The fresh plunge in sales sent months of inventory soaring from 7.7 to 9.3 just over the 9.0 level from April. The absolute inventory level increased 3.9% to 444,000. Unlike the market for existing homes, the market for new homes is well-supplied. The high inventory will likely push builders to slow starts further in coming months.
Northeast new home sales fell 37.9% year-over-year to a 7-year low. The Midwest suffered its ninth straight month with a significant decline; this time the year-over-year plunge equaled 22.1%. The Midwest actually rebounded a bit from May. The South was the only region to escape double-digit losses with a loss of 8.7%. The West declined 32.9% year-over-year to an 8-year low. No wonder investors are building from the bottom and behaving as if the business for home builders cannot get much worse!
![Regional new one family home sales Source: U.S. Census Bureau and U.S. Department of Housing and Urban Development, New One Family Houses Sold in South Census Region [HSN1FS], Midwest Census Region [HSN1FMW], Northeast Census Region [HSN1FNE], West Census Region [HSN1FW], retrieved from FRED, Federal Reserve Bank of St. Louis, May 1, 2022.](https://fred.stlouisfed.org/graph/fredgraph.png?g=SucT)
Home Builder Confidence: The Housing Market Index – July, 2022
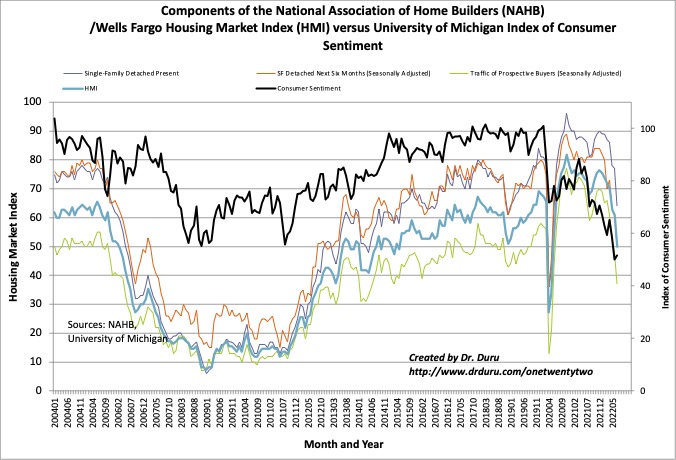
The Housing Market Index (HMI) plunged from 67 to 55 in July. I previously assumed that the normalization process for HMI would take the indicator for home builder sentiment to the 2017 to 2019 range. Now, the HMI is at the bottom of that range with downward momentum increasing the odds of breaking down lower. Interestingly, consumer confidence ticked up slightly in contrast to the plunging HMI. The Traffic of Prospective Buyers (Seasonally Adjusted) led the way down again for the components of the HMI. Its 11 point drop to 37 sent the indicator of future demand to a 7 1/2 year low.

Source for data: NAHB and the University of Michigan
Poor sentiment has helped lead to 13% of builders in the HMI survey “…reducing home prices in the past month to bolster sales and/or limit cancellations.” The NAHB did not provide points for comparison, but I assume this percentage represents an increase. I will be looking to see whether these price actions were deep or broad enough to impact the pricing data for July.
Unlike the June report, the July HMI fell broadly across regions. The South and the West were hit the hardest. The South fell from a lofty 75 down to 60. The West fell from 64 to 48. The Northeast dropped from 62 to 57. The Midwest fell from 55 to 49.
Home closing thoughts
Spotlight on Mortgage Rates
The potential peaking of mortgage rates in May was a headfake, but now rates are below 5.0% for the first time in 4 month. Rates fell for most of July. The decline was so steep that the June peak near 6.0% looks like a truly sustainable top. Mortgage rates raced Fed rate hikes, so there is room to give to the downside. I suspect that once it is clear mortgage rates have stopped climbing higher, the stability will translate into more stability for the housing market and increasing confidence. Note that there are early signs that the drop in rates is bringing people back to the market. Mortgage applications actually increased week-over-week. Just one slim, green shoot indicating a building from the bottom.
![Sources include: Board of Governors of the Federal Reserve System (US), Market Yield on U.S. Treasury Securities at 30-Year Constant Maturity [DGS30], retrieved from FRED, Federal Reserve Bank of St. Louis and Freddie Mac, 30-Year Fixed Rate Mortgage Average in the United States [MORTGAGE30US], retrieved from FRED, Federal Reserve Bank of St. Louis, May 1, 2022](https://fred.stlouisfed.org/graph/fredgraph.png?g=Syfj)
Be careful out there!
Full disclosure: long ITB shares

