
Housing Market Intro and Summary
A month ago, housing-related stocks managed to stabilize despite deteriorating data. Reality caught up in June with a fresh round of selling in the stocks of home builders. A surprising jump in new home sales provide some relief for an otherwise on-going din of negative housing news. The National Association of Builders (NAHB) even made dire predictions of economic weakness ahead. Yet, housing prices promise to remain elevated with low inventories and robust sales activity among existing buyers. A recent reversal in interest rates promises to put a floor on housing activity as long as the inflationary outlook trends downward. Earnings from home builders provided additional hints of a floor in the housing market.
Housing Stocks
In May the iShares US Home Construction ETF (ITB) managed to gain 4.5% and to outpace the S&P 500 (SPY). June was a much different story. ITB plunged 13.0% and under-performed the S&P 500’s 8.4% loss. At one point, ITB even finished reversing all its pandemic era gains with a close below its pre-pandemic high. The recent rebound comes alongside a sudden reversal in long-term rates. Financial markets are transitioning to bets that inflation will be much lower in the future.
")
The rebound also followed earnings reports from Lennar (LEN) and KB Home (KBH). Both stocks bottomed in the wake of these reports with commentary that was not nearly as dire as one might expect under the circumstances.
KB Home stuck by its guidance for the year and expects expanded revenues and margins in the second half along with an increased community count. The company even reported filling its backlog for Q1 2023. This confidence speaks to a floor in the business for now.
Lennar observed “While the market has cooled, it has clearly not stopped. Demand remains reasonably strong as buyers still have down payments and have attractive credit scores and can qualify…Buyers are seeking shelter from inflationary pressures as scarce rentals drive rents higher. Supply remains limited across the country and the need for affordable workforce housing continues to be at crisis levels” (from the Seeking Alpha transcript). In other words, Lennar also sees a floor in the market despite tougher market conditions. Importantly, Lennar stuck by its delivery guidance for the year (68,000 homes). The company also maintained strong Q3 guidance on pricing and margins. So what pricing actions, if any, will Lennar need to execute in Q4 to achieve delivery guidance?
")
Housing Data
New Residential Construction (Single-Family Housing Starts) – May, 2022
The top is in for single-family housing starts since levels dropped below the starts for May, 2021. Still, the 1M mark continues to look like an approximate bottom for now.
Starts decreased 5.5% from April to May’s 1,048,000 and decreased 7.9% year-over-year. April’s starts were revised upward to 1,157,000. Starts still look like they can settle into a range if economic conditions stabilize soon. As I noted previously, a breakdown lower would signal a further contraction in expectations for future sales.
![Source: US. Bureau of the Census, Privately Owned Housing Starts: 1-Unit Structures [HOUST1F], first retrieved from FRED, Federal Reserve Bank of St. Louis, June 27, 2022.](https://drduru.com/onetwentytwo/wp-content/uploads/2022/06/220627_Housing-Starts.png "Housing starts")
Starts in each region declined sequentially and year-over-year, ending the large year-over-year gains for the Northeast and the West. The South is notable as the region with the largest decline. Note that the South experienced large dips to lower levels in early 2021. Housing starts in the Northeast, Midwest, South, and West each changed -3.2%, -5.8%, -9.9%, and -4.9% respectively year-over-year.
Existing Home Sales – May, 2022
If not for the decline in sales, you could conclude that the market for existing homes is nearly as tight as ever. Every other metric still looks like it comes from a hot marketplace. The households who can still afford today’s prices are as eager as ever to purchase a home. A segmentation across price tiers and/or square footage would provide more insight under the hood, but the NAR did not provide such data in this report. The NAR did indicate that homes priced “appropriately” are selling quickly. Moreover, inventory needs to double from current levels to alleviate price pressures. In other words, pricing pressures will likely persist for quite some time.
For the second report in a row, the NAR predicted more weakness for sales: “Further sales declines should be expected in the upcoming months given housing affordability challenges from the sharp rise in mortgage rates this year.” For reference, pre-pandemic home sales activity was 5.0M to 5.5M in 2019. Existing home sales dropped for a fourth month in a row after January’s all-time high. The seasonally adjusted annualized sales in May of 5.41M decreased 3.4% month-over-month from the slightly downwardly revised 5.6M in existing sales for April. Year-over-year sales decreased 8.6%. Existing home sales have full normalized.

(For historical data from 1999 to 2014, click here. For historical data from 2014 to 2018, click here) Source for chart: National Association of Realtors, Existing Home Sales© [EXHOSLUSM495S], retrieved from FRED, Federal Reserve Bank of St. Louis, June 27, 2022.

Inventory and prices are far from normalized.
April’s absolute inventory level of 1.16M homes increased 12.6% from April, marking an extremely rare fourth straight monthly increase. Still, inventory dropped 4.1% year-over-year (compare to April’s 10.4%, March’s 9.5%, February’s 15.5%, January’s 16.5%, December’s 14.2%, November’s 13.3%, October’s 12.0%, September’s 13.0%, August’s 13.4%, and July’s 12.0% year-over-year unrevised declines). “Unsold inventory sits at a 2.6-month supply at the current sales pace, up from 2.2 months in April and 2.5 months in May 2021.” The on-going year-over-year decline in inventory is on a 37-month streak and unsold inventory levels are barely off the record lows.
Yet again, the increase in absolute inventories did not impact the time it took for buyers to take a home off the market. The average 16 days it took to sell a home in May was down from 17 in the prior month and year. This rapid turnover demonstrates the strength of market demand among those who can still afford a home.
The increase in inventory also did not slow down the linear march higher in prices. The median price of an existing home increased 3.1% from April to $407,600, another all-time high, and soared 14.8% year-over-year for the second month in a row. Prices have increased year-over-year for 123 straight months, an on-going record streak.
First-time home buyers pulled back in share a second straight month after 2 straight months of share gains. First-time home buyers decreased to a 27% share of sales in May, down from 28% in April and 31% a year ago. These recent declines suggest that the on-going gains in median prices is driven from homes sold at higher price tiers. The NAR’s 2017 Profile of Home Buyers and Sellers reported an average of 34% for 2017, 33% for 2018, 33% for 2019, 31% for 2020, and 34% for 2021. Interestingly, individual investors or second home buyers did not step into the share gap and again dropped in share. This time, these buyers dropped from 17% to 16% month-over-month and year-over-year.
All regions declined in sales year-over-year. The regional year-over-year changes were: Northeast -9.3%, Midwest -9.5%, South -8.4%, West -10.0%.
For the eighth month in a row, the South’s median price soared year-over-year. Inflation could continue the price divergence of the South from other regions; the South has outpaced the other three regions 9 months in a row. The regional year-over-year price gains were as follows: Northeast +6.7%, Midwest +9.5%, South +20.6%, West +13.3%.
Single-family home sales decreased 3.6% from April and declined on a yearly basis by 7.7%. The median price of $414,200 was up 14.8% year-over-year.
California Existing Home Sales – May, 2022
The California Association of Realtors (C.A.R.) called the Californian market for existing homes more balanced. However, the divergence between the high-end and low-end grew more extreme and the median home price continued higher to a new record. The C.A.R. defined balanced as “fewer homes selling above list price and homes remaining on the market a little longer than in previous months.” The sales-price-to-list-price ratio only dropped from 103.8% to 103.4% year-over-year. The median number of days for a home on the market was still just 9 days, a 2 day year-over-year improvement and up from 8 days in April. The prediction for worsening affordability also belies the description of a more balanced market:
“…a record increase in the average monthly mortgage payment to a typical home by more than 40 percent in May. With the Fed expected to raise rates further in the second half of the year, the 30-year fixed rate mortgage could surge past 6 percent by year’s end and lead to more affordability challenges for potential homebuyers.”
Active listings showed the most dramatic change although the unsold inventory index (UII) only “climbed back above 2 months for the first time in three months.” Total active listings soared 46.7% year-over-year to their highest level since July 2020.
April’s share of million-dollar home sales hit a new all-time record at 35.3%. The other end of the market, below $500K, hit a record low. This trajectory of divergence continues to follow C.A.R.’s expectations.
California’s existing homes sales decreased 9.8% month-over-month. For May, the C.A.R. reported 377,790 in existing single-family home sales. Sales decreased 15.2% year-over-year. The broad based price increases continued. May’s $898,980 median price was a 1.6% month-over-month increase in-line with the historical, seasonal average. The median price increased 9.9% year-over-year.
New Residential Sales (Single-Family) – May, 2022
New home sales of 696,000 were actually UP 10.7% from April’s 629,000. Sales were down 5.9% year-over-year. The rebound in sales looks like a residual vestige of the spring selling season. The National Association of Home Builders (NAHB) pointed to a rush to buy ahead of the Fed’s June rate hike, but that explanation ignores the parallel decline in existing home sales. I am more intrigued by the possibility of home builders serving up sales incentives. In its earnings call, Lennar acknowledged incentives increased sequentially over the past three months but remained “slightly lower than the average new sales ordering incentive for the latest 12 months.”
![Source: US. Bureau of the Census, New One Family Houses Sold: United States [HSN1F], first retrieved from FRED, Federal Reserve Bank of St. Louis, June 28, 2022.](https://drduru.com/onetwentytwo/wp-content/uploads/2022/06/220628_New-Home-Sales.png "new home sales")
The rebound in sales was led by a surge in sales share from the $300,000 to $399,999 price range which sits directly below the $449K median price. The next tier higher was the only other tier to gain share. This surprising shift brought the median home price off its all-time high by 1.3%. The median price still jumped 15.0% year-over-year.
The jump in sales brought an abrupt end to the increasing inventory trend of the previous 4 months. The months of inventory plunged from 9.0 to 7.7. The absolute inventory level stayed flat month-over-month at 444,000.
The two-month boom in the Northeast came to a screeching halt with a 42.5% year-over-year decline. The Midwest suffered its eighth straight month with a significant decline; this time the year-over-year plunge equaled 37.0%. The South and the West flattened out with 1.5% and 0.5% year-over-year gains. The resulting month-over-month patterns show the South and West leading May’s rebound while the Northeast and Midwest were significant laggards.
![Source: U.S. Census Bureau and U.S. Department of Housing and Urban Development, New One Family Houses Sold in South Census Region [HSN1FS], Midwest Census Region [HSN1FMW], Northeast Census Region [HSN1FNE], West Census Region [HSN1FW], retrieved from FRED, Federal Reserve Bank of St. Louis, May 1, 2022.](https://fred.stlouisfed.org/graph/fredgraph.png?g=Q4U9 "Regional new one family home sales")
Home Builder Confidence: The Housing Market Index – June, 2022
The National Association of Home Builders (NAHB) raised the volume on the economic alarm with its June report on home builder confidence. The NAHB is looking ahead to deepening economic woes: “In a troubling sign for the housing market, builder confidence in the market for newly built single-family homes posted its sixth straight monthly decline in June…Six consecutive monthly declines for the HMI is a clear sign of a slowing housing market in a high inflation, slow growth economic environment.” While the additional drop of 2 points looks awful relative to the euphoria in sentiment after the pandemic trough, a longer-range perspective reminds us that sentiment could be descending into a normalizing period back to pre-pandemic levels, especially between 2017 and 2019.
")
Source for data: NAHB and the University of Michigan
The Traffic of Prospective Buyers (Seasonally Adjusted) led the way down for the components of the HMI. Its 5 point drop to 48 placed this indicator of future demand at a 2-year low when the economy was just climbing out of the pandemic-driven trough. The other components also hit 2-year lows. The most striking sentiment figure remains the University of Michigan’s Index of Consumer Sentiment. The plunge since the last peak in April, 2021 has perhaps been the strongest leading indicator of all.
Regional sentiment has plunged at different paces. The Northeast increased by two points in May along with improving new home sales only to plunge by 14 points in June to a 2-year low. The West dropped 10 points in May and another 9 points in June to hit a 2-year low. The Midwest hit a 3-year low in May and managed to rebound by 3 points in June. After falling 6 points in May, the South only fell 1 point in June, not quite a 2-year low.
Home closing thoughts
Profiting from the Pandemic Emergency
The Joint Center of Housing Studies (JCHS) of Harvard University published an intriguing interpretation of the Annual Mortgage Bankers Performance Report from the Mortgage Bankers Association (MBA). In “The Policymaking Implications of Record-High Mortgage Origination Profits During the Pandemic” the JCHS point out that mortgage lending firms were large beneficiaries of the Federal Reserve’s record low interest rates. Recall that the Fed rapidly cut rates (and instituted other extreme monetary measures) to respond to the pandemic’s economic emergency.
“The tsunami of refinances generated by the Federal Reserve’s aggressive cutting of interest rates overwhelmed the primary market lenders. The result was a market in which they did not feel a competitive need to fully pass through those lowered interest rates. Instead, to equilibrate supply with the massively increased demand, they raised their margins by reducing interest rates to homeowners in an amount measurably less than if the much-lowered secondary market interest rates had been fully passed through to homeowners.”
The JCHS called the resulting surge in profitability “an extraordinary increase during the dislocations of the pandemic.” However, the party is over now. The MBA itself issued the following warning in its report:
“After a truly phenomenal ride for mortgage companies, more difficult times are expected in 2022 and possibly beyond. The widespread upward pressure on rates will diminish rate-term refinance volume, and housing inventory shortages pose challenges for purchase originations…Staying profitable will require prudent cost management, as well as more reliance on servicing operations to serve as a hedge against production declines.”
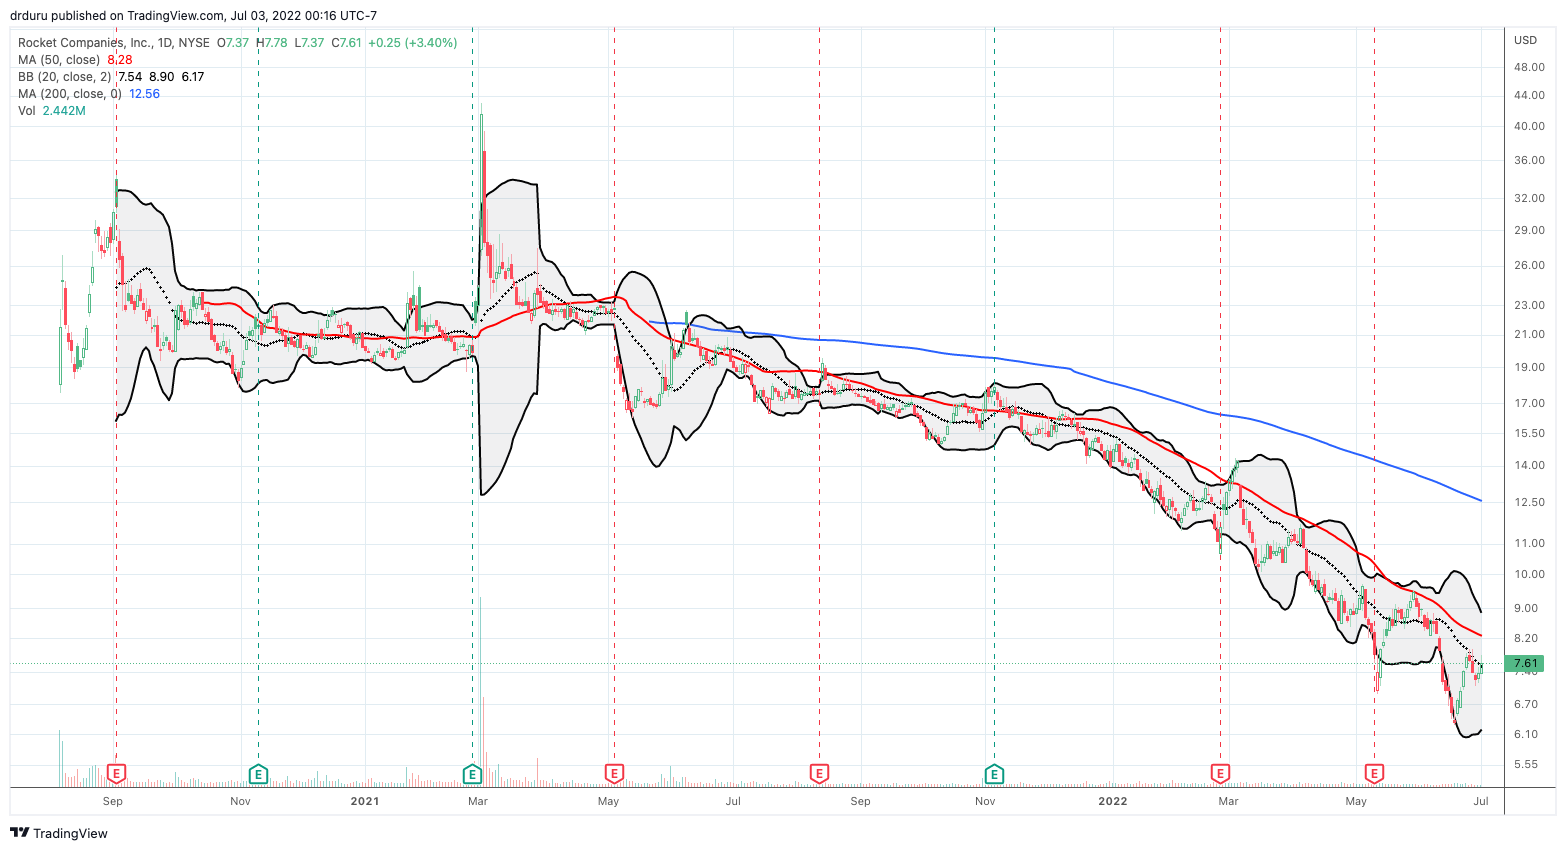
Stocks like Rocket Mortgage (RKT) seem to confirm the roof has indeed caved in on the party. Indeed, RKT came to the public markets in the immediate wake of the Fed’s largesse. The stock gyrated in a wide range before beginning a descent that continues today. I benefited from the trading opportunities but got caught in the downtrend.
Spotlight on Mortgage Rates
The potential peaking just above 5% in mid-May turned into a major headfake. The 30-year mortgage ended the first half of the year at an astounding 5.7%, just off levels last seen in 2008. Needless to say, rate-related pressures will cascade into the market-cooling months following the Spring selling season.
![Sources include: Board of Governors of the Federal Reserve System (US), Market Yield on U.S. Treasury Securities at 30-Year Constant Maturity [DGS30], retrieved from FRED, Federal Reserve Bank of St. Louis and Freddie Mac, 30-Year Fixed Rate Mortgage Average in the United States [MORTGAGE30US], retrieved from FRED, Federal Reserve Bank of St. Louis, May 1, 2022](https://fred.stlouisfed.org/graph/fredgraph.png?g=Q7uT)
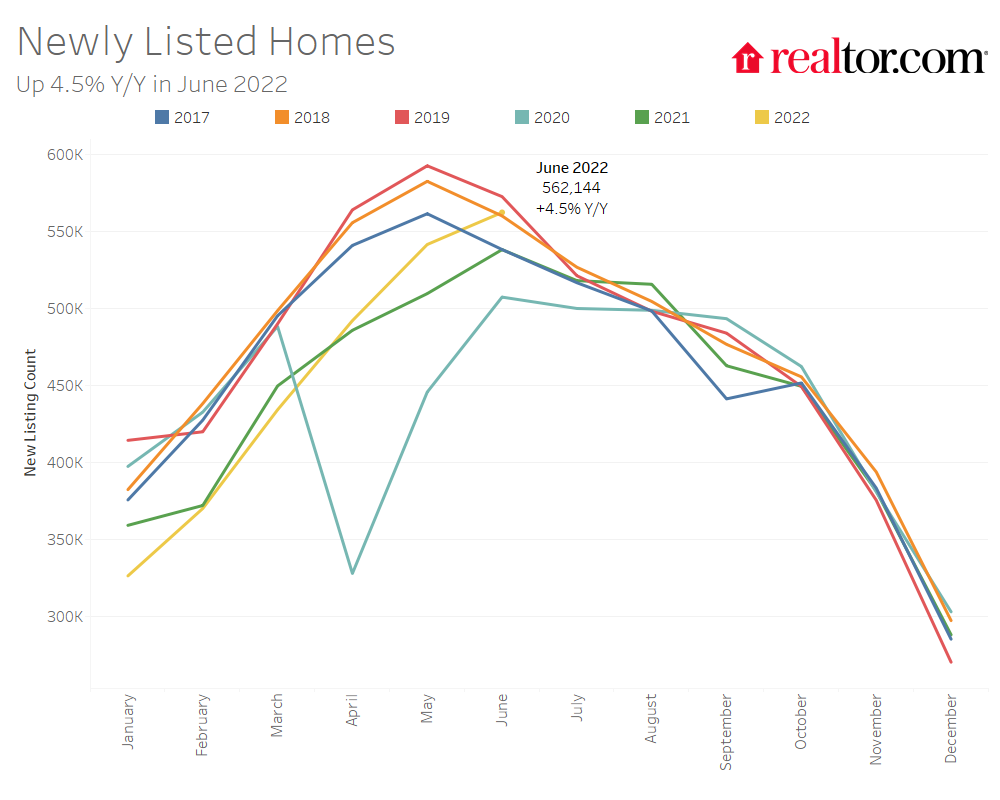
A Long Way to Go for Active Listings
Realtor.com provides a monthly housing report. In June’s report, I took note of the long path ahead to normalize overall inventory levels of homes as represented by active listings. Current levels remain well behind previous years despite a recent surge in newly listed homes. This additional way to review the inventory shortage reinforces the likely stickiness of future home prices.

Be careful out there!
Full disclosure: long ITB shares, long RKT