Stock Market Commentary:
The stock market overcame a serious setback with an impressive rebound. The rally started before Jay Powell announced the Federal Reserve’s latest decision on monetary policy and pushed higher afterward. The market seemed determine to launch as the opening gap up immediately erased the previous day’s loss. Buyers never looked back and seemed to gain further encouragement from Powell’s commentary, including the proclamation that “we are not in a recession.”
Cathie Wood did not get her wish for a contrite Fed. Instead, Powell insisted BOTH that the economy is not in a recession AND that the economy needs a period of “below trend growth” and a “softening” in the labor market to achieve a sustainable pricing environment. Given Wall Street’s rationale for wanting a recession was to force the Fed to stop the monetary pain, the market’s rally in the face of Powell’s steady commentary was a bit ironic, if not outright eerie. The Fed Fund Futures maintained a projected peak in rates at 3.5% with the first rate cut pulled in by a month to May, 2023.
Powell reinforced the overall glide path by acknowledging that the pace of rate increases will likely slow down going forward. However, he left all options on the table by admonishing markets that another large increase is possible. The Fed also declined to give forward guidance. Learning the lesson of prior errors and forced pivots, the Fed will now take things one meeting at a time. I am VERY interested to see whether Fed-speak between meetings becomes just as obtuse.
Here are some other bullets I noted from Powell’s conference call:
- Over coming months, the Fed will be looking for compelling evidence of moderating inflation. The last inflation reading was even worse than expected. (In other words, no one should get excited by the “peak inflation” narrative).
- Inflation has surprised to the upside over the past year and further surprises could be ahead. (This stark reality is keeping the Fed cautious about projections).
- Today’s 75 basis points increase to 2.25 to 2.50% puts the Fed’s rate in neutral territory.
- The strong labor market suggests that the economy is not in a recession (in other words, stop using the two straight quarters of negative GDP growth as a recession shorthand). Powell even questioned the GDP data and reminded the audience that GDP gets revised over time.
- Starting rate hikes 3 months earlier would not have mattered (in other words, the Fed rejects the notion some of us accept that it got a late start to monetary normalization).
- The Fed is trying to avoid a taper tantrum: past ones had consequences for the economy (2013 and 2018).
The Stock Market Indices
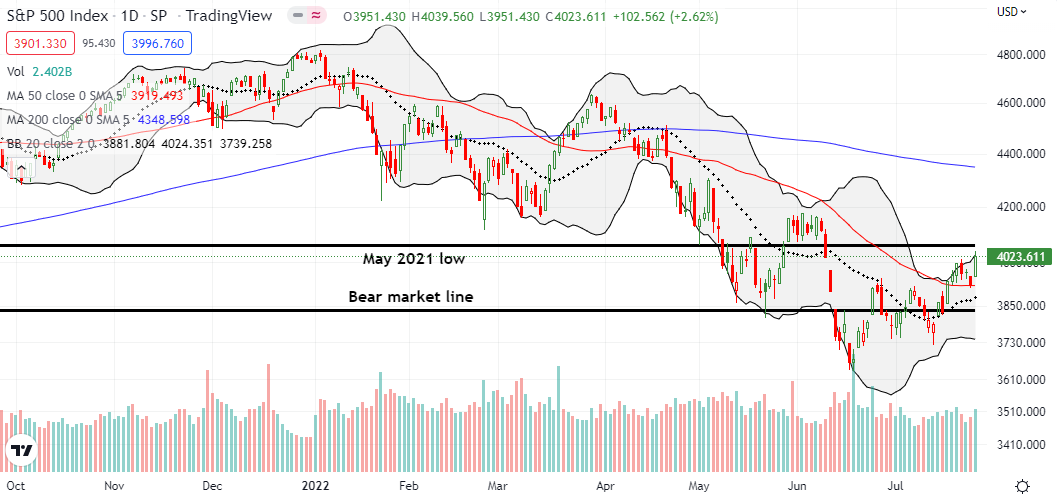
The S&P 500 (SPY) gained 2.6% with a launch to a 7 week high. The index left behind the psychologically important 4000 level and has its sights on resistance at the May, 2021 low. From there the S&P 500 will have to contend with even tougher resistance at the June highs. The technicals are threading a needle given one more gain confirms a successful test of support at the 50-day moving average (DMA). That confirmation would come in conjunction with a tango with resistance.
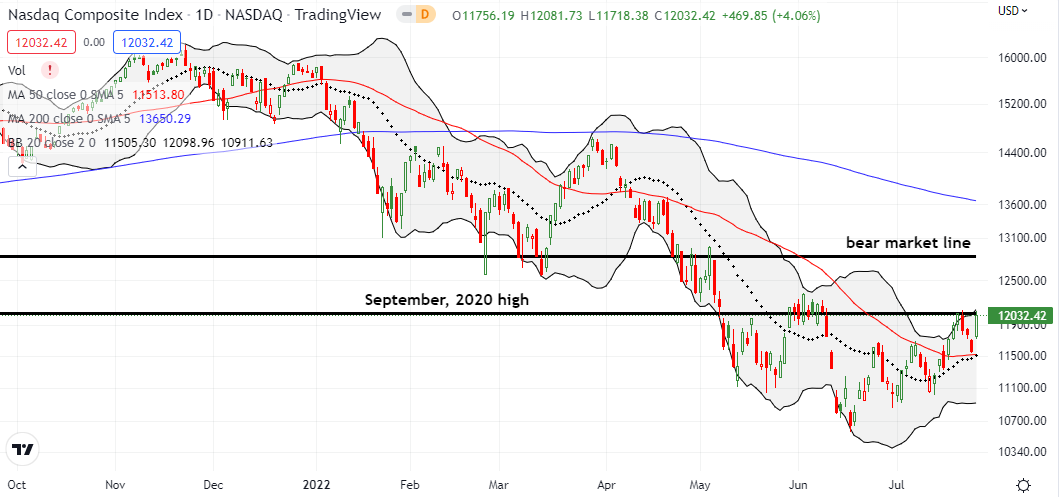
The NASDAQ (COMPQ) took its rocket fuel into a launch that reversed three days of losses from the serious setback of the synchronized breakout. The 4.1% gain looked impressive both on its own and relative to a setback that seemed poised to greet Chair Powell with bad news. Instead, the tech laden index pulled off a picture-perfect test of 50DMA support. Another gain would create a very important breakout above the September, 2020 high and set up challenges of the June highs and even the bear market line. I am still holding a QQQ calendar call spread at the $305 strike.
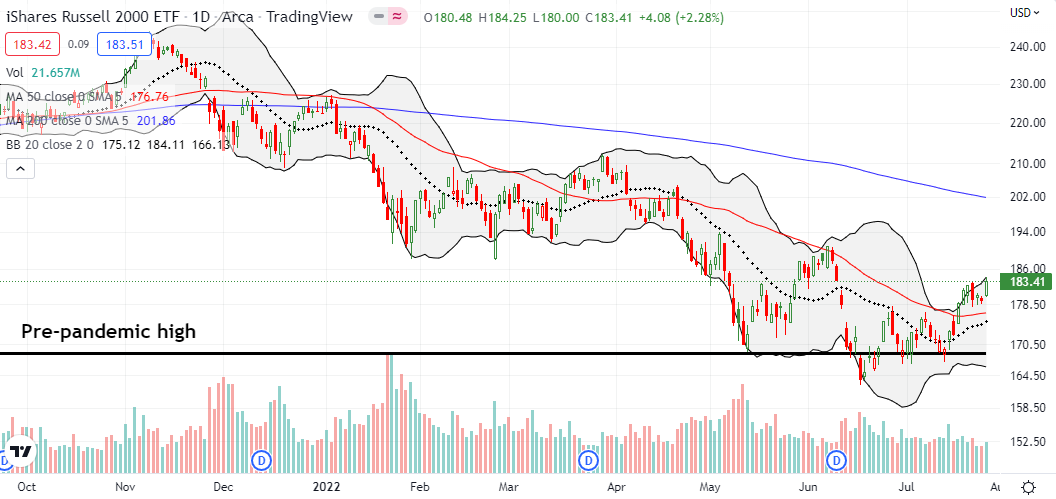
The iShares Russell 2000 ETF (IWM) had less at stake than the other two indices. The ETF of small caps went into the Fed meeting without a test of 50DMA support on the line. IWM’s 2.3% gain created a 7-week high. IWM has a lot of room to gain before challenging its June high. Still, I sold my IWM call option expiring this Friday. It survived a calendar call spread I bought last week. I am now looking to refresh an IWM position.
Stock Market Volatility
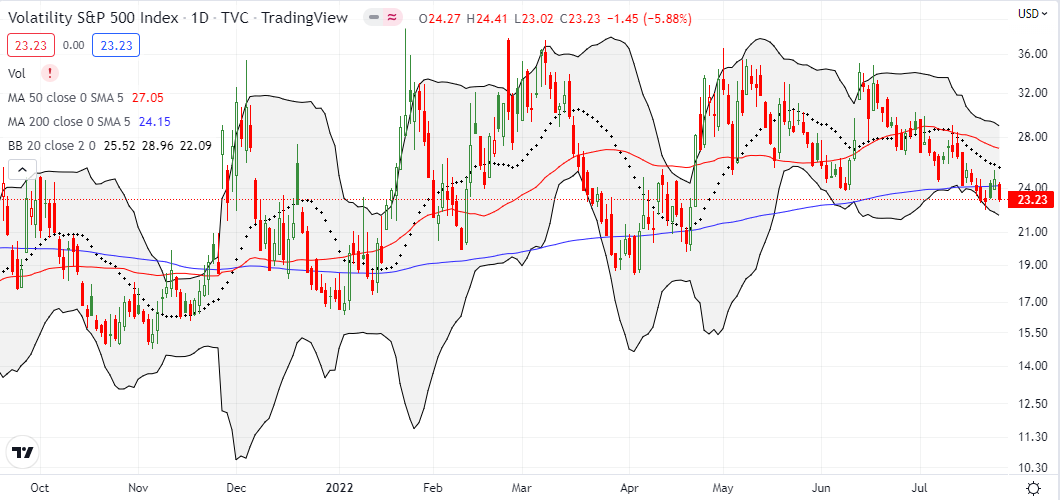
The volatility index (VIX) sank to a new three month low last Friday despite the stock market’s big setback. The VIX got back in gear going into the Fed meeting. However, the market’s rally dropped the VIX right back to last week’s low. Thus, the VIX is once again confirming a bullish tone.
The Short-Term Trading Call With A Launch
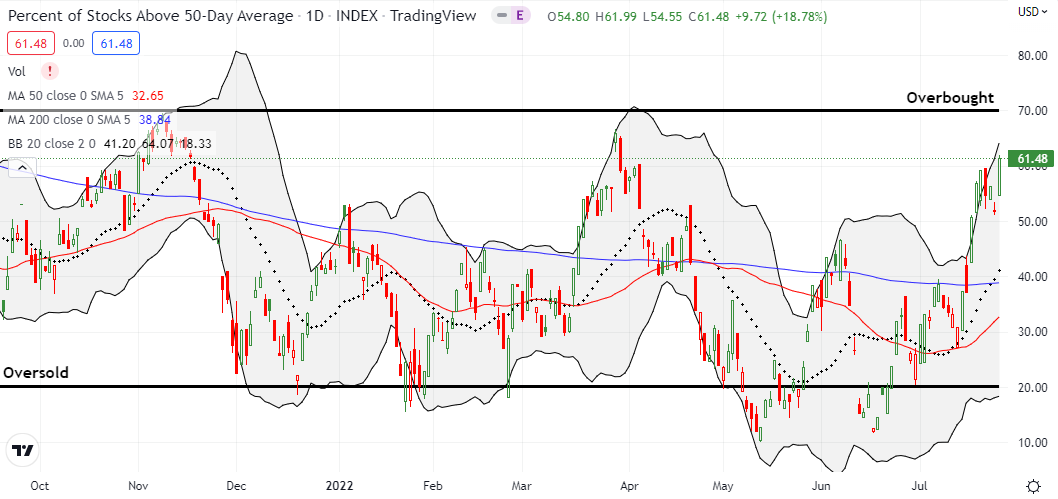
- AT50 (MMFI) = 61.5% of stocks are trading above their respective 50-day moving averages
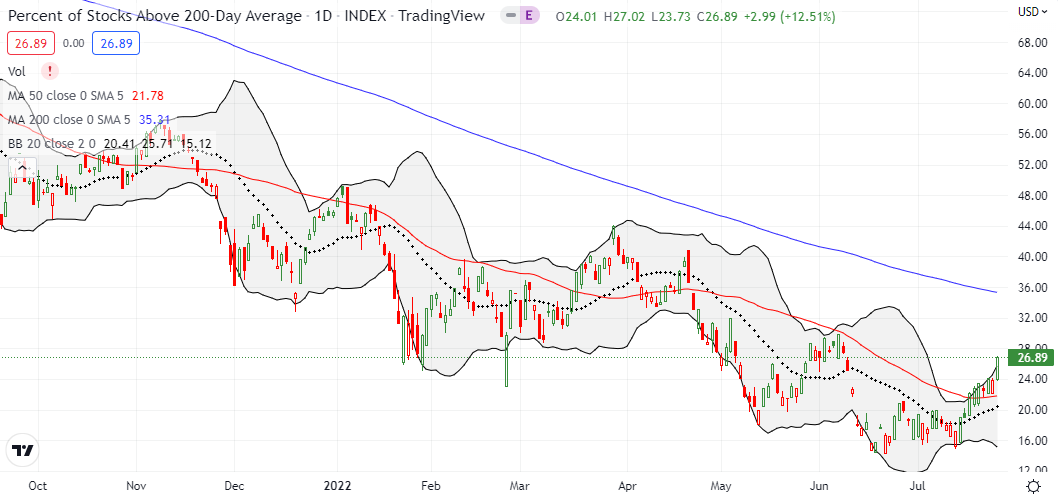
- AT200 (MMTH) = 26.9% of stocks are trading above their respective 200-day moving averages
- Short-term Trading Call: neutral
AT50 (MMFI), the percentage of stocks trading above their respective 50DMAs, made an impressive recovery. My favorite technical indicator launched from 51.8% and gained almost 10 percentage points. MMFI pulled off its second highest close of the year. Thus, while the surge looks bullish, I am on alert for a fresh test of the overbought threshold at 70%. As a reminder, a failed test of this threshold is bearish for the stock market, and I will change my short-term trading call accordingly. In the meantime, I am leaving the call at neutral even as I have zero interest in extending bearish bets ahead of a new signal. With hindsight I am really glad I resisted the temptation to flip bearish after Friday’s setback!
Next up, the market’s reaction to Q2 GDP…
Be careful out there!
Footnotes
“Above the 50” (AT50) uses the percentage of stocks trading above their respective 50-day moving averages (DMAs) to measure breadth in the stock market. Breadth defines the distribution of participation in a rally or sell-off. As a result, AT50 identifies extremes in market sentiment that are likely to reverse. Above the 50 is my alternative name for “MMFI” which is a symbol TradingView.com and other chart vendors use for this breadth indicator. Learn more about AT50 on my Market Breadth Resource Page. AT200, or MMTH, measures the percentage of stocks trading above their respective 200DMAs.
Active AT50 (MMFI) periods: Day #20 over 20%, Day #14 over 30%, Day #7 over 40%, Day #7 over 50%, Day #1 over 60% (overperiod ending 79 days under 60%), Day #351 under 70%
Source for charts unless otherwise noted: TradingView.com
Full disclosure: long QQQ calendar call spread, QQQ put spread
FOLLOW Dr. Duru’s commentary on financial markets via StockTwits, Twitter, and even Instagram!
*Charting notes: Stock prices are not adjusted for dividends. Candlestick charts use hollow bodies: open candles indicate a close higher than the open, filled candles indicate an open higher than the close.


