Checking the Google Trends Momentum Check
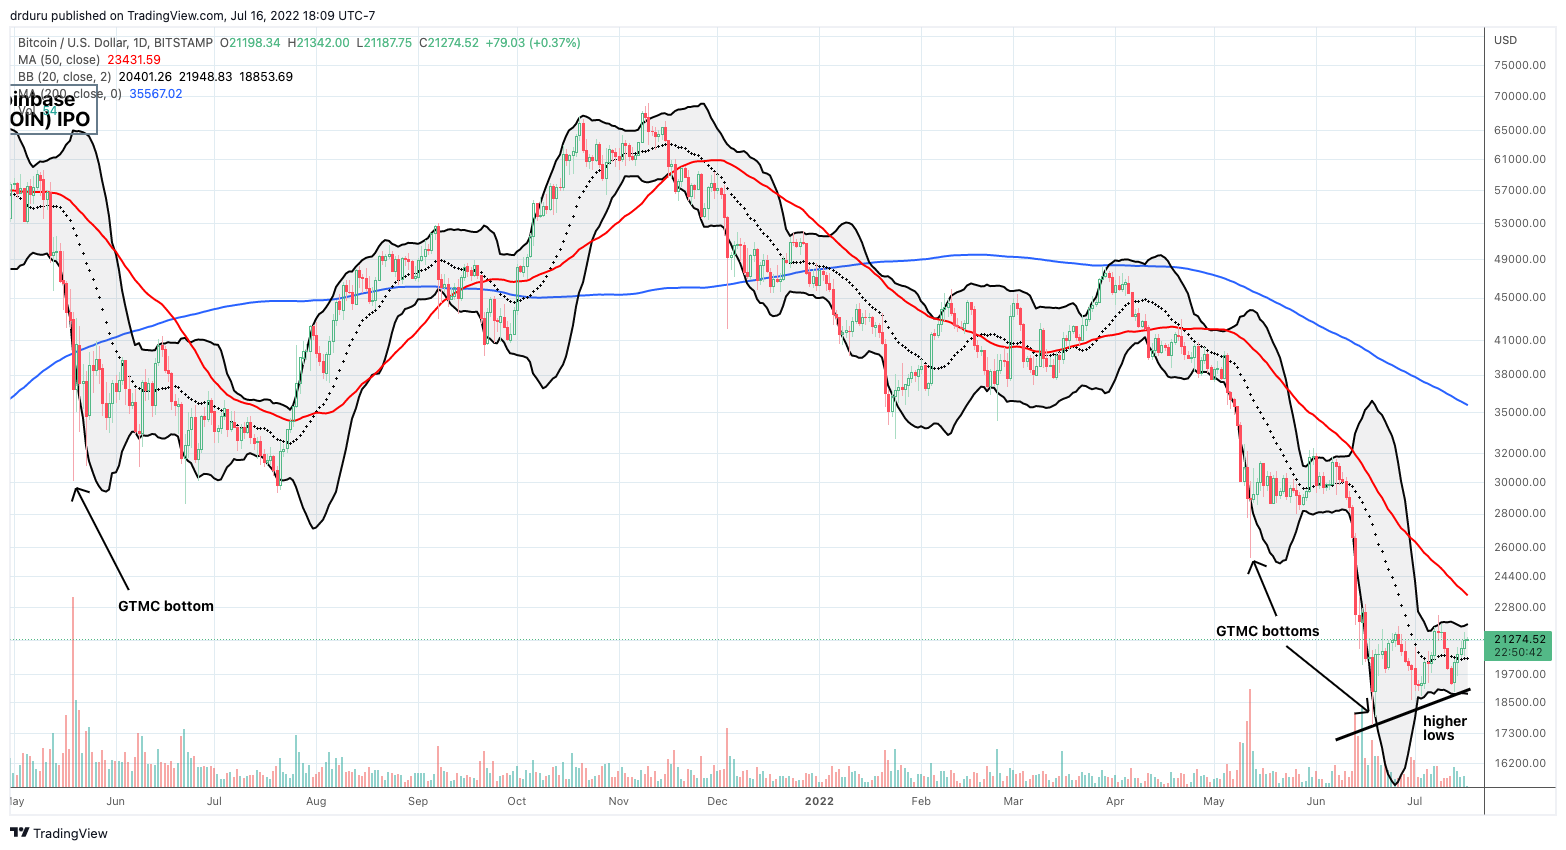
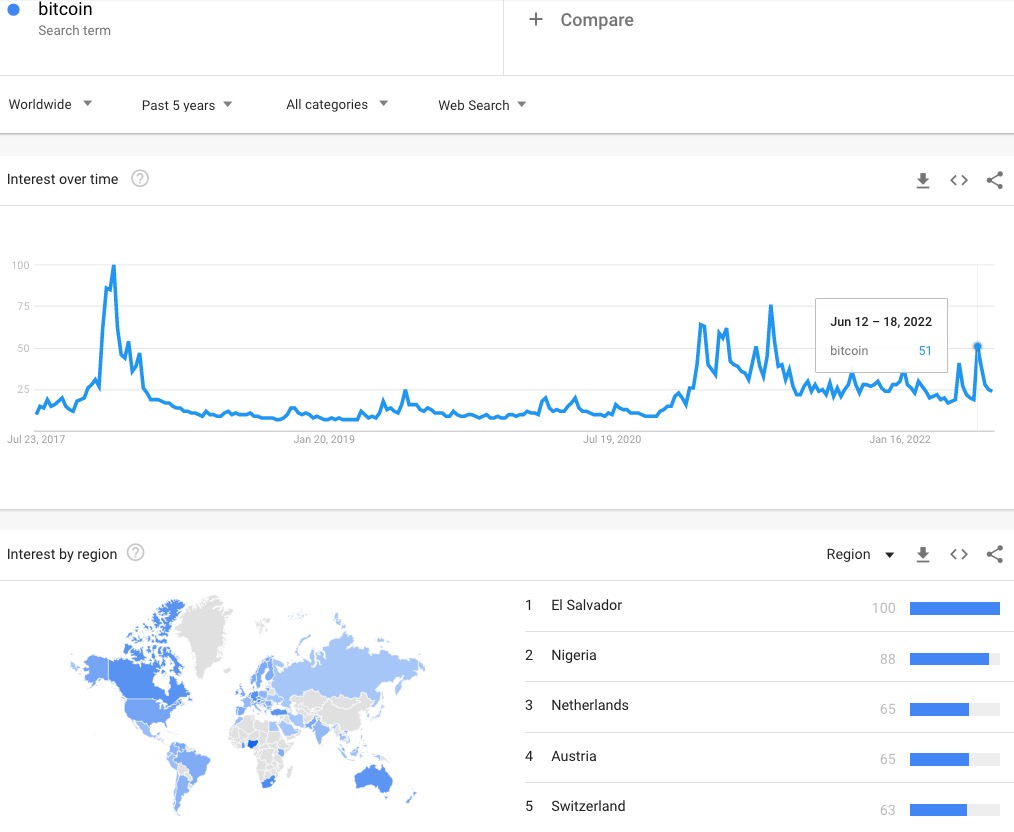
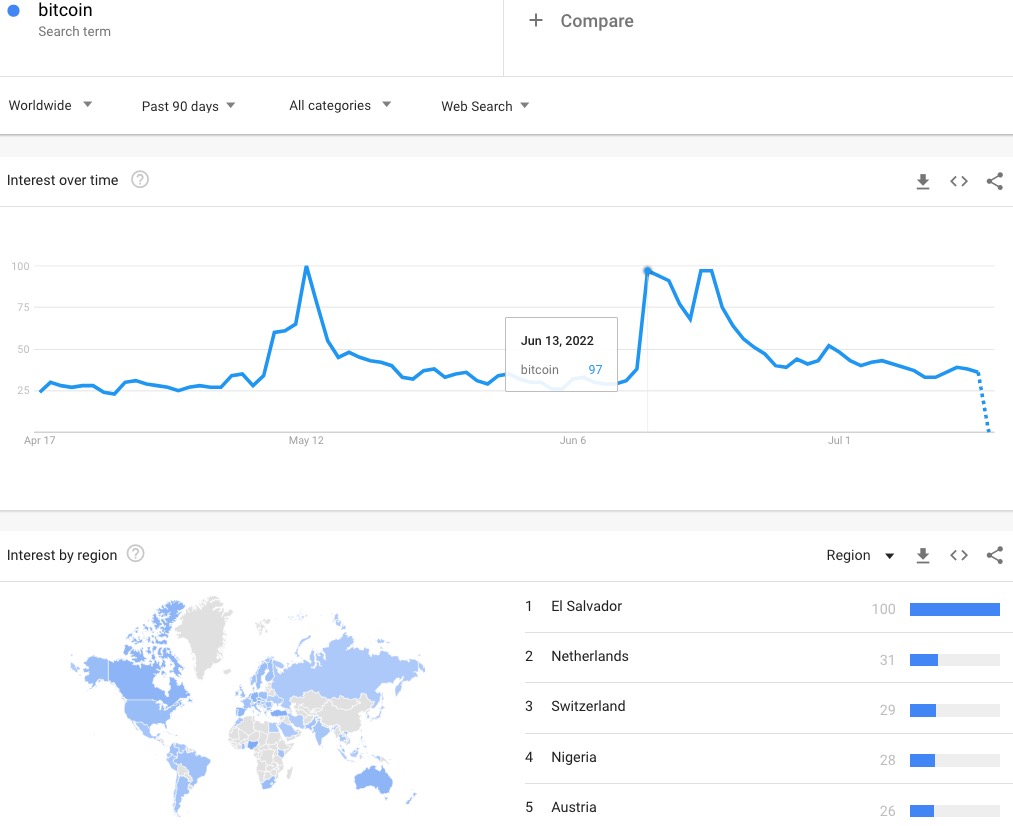
The Google Trends Momentum Check (GTMC) continues to perform well as a signal for a bottom in downward price action for Bitcoin (BTC/USD). Even the brutal crypto winter has delivered two more examples of how this indicator works. As a reminder, the GTMC signals a potential bottom when (worldwide) Google trends for the search “bitcoin” increases sharply in conjunction with an extreme price move in BTC/USD. It is a sufficient signal for a potential bottom but not a necessary one. Moreover, the signal does not indicate the duration of the bottom. The latest bottom in Bitcoin from June 18th is now a month and running. The GTMC bottom from May 12th held for exactly one month before conceding defeat to the latest price collapse.

The Google trends chart below has a weekly timeline. The sharp increases that coincide with the Bitcoin chart happened on June 13th, June 18th, and June 19th (for a UNIQUE triple high in the Google trends spike), May 12th, and May 19, 2021. That 2021 bottom was the most successful of the three, but it took over two months of patience to bear fruit for short-term trades. The June drama was the aftermath of crypto lender Celsius suspending withdrawals on the way to its bankruptcy three days ago. That period also marked the last bottom for the stock market as crypto remains highly correlated to stocks.


The Trade
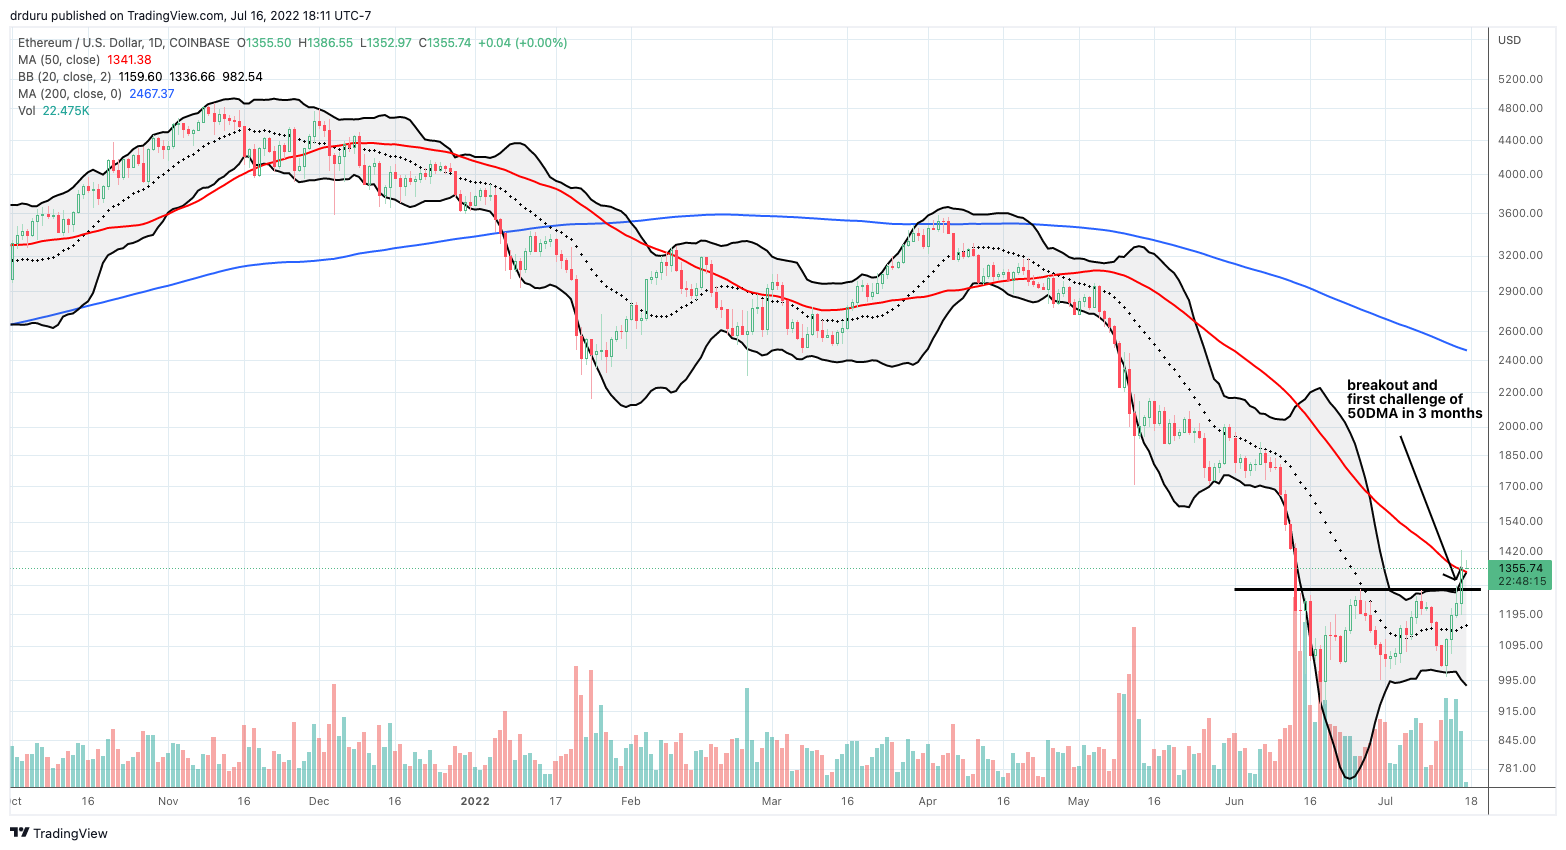
Per my overall plan, I have accumulated Bitcoin (BTC/USD) and Ethereum (ETH/USD) on weakness. The current weakness has persisted so long and so deeply that I have had few opportunities to flip short-term trades. This weekend delivered the best opportunity in a long time with ETH/USD suddenly breaking out. I took profits on the last tranche that I bought right at $1000. This breakout heightens the prospects for an imminent Bitcoin breakout. Accordingly, I will buy the next dip in BTC/USD if one comes before a breakout. The pattern of higher lows also supports upward pressure on the current trading range.

Be careful out there!
Full disclosure: long BTC/USD, long ETH/USD, long GBTC, long BITO

