Stock Market Commentary
Central banks are scrambling in the face of what is becoming a summer of discontent. Last week was chock full of news from monetary policy. The Federal Reserve, the Bank of England (BoE), and even the Swiss National Bank all took action against inflation. The European Central Bank (ECB) held an (underwhelming) emergency meeting to address growing instability in its bond markets. The Bank of Japan (BoJ) stood out among central banks. The BoJ kept rates and quantitative easing steady as it still sees no real inflationary pressures: “the year-on-year rate of change in the CPI (all items less fresh food and energy) is expected to moderately increase in positive territory on the back of improvement in the output gap and rises in medium- to long-term inflation expectations and wage inflation, and partly also of a pass-through of raw material cost increases.”
Conditions look poor for new investments and a sustainable bottom looks elusive. Any rallies that materialize seem likely to crash into brick walls of resistance. An extended bear market is well underway.
The Stock Market Indices
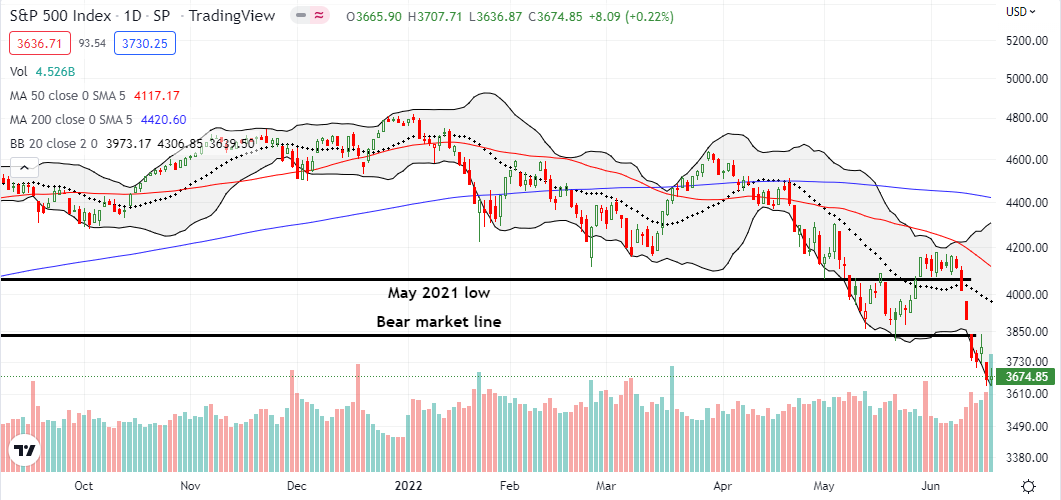
A day after testing resistance at the bear market line, the S&P 500 (SPY) fell 3.3%. On Friday, the index barely stabilized with a 0.2% gain. While I earlier wrote about my expectations for a post-Fed fade, I definitely did NOT expect such a thorough thrashing. On Thursday, the S&P 500 gapped all the way down to its December, 2020 closing low and sellers never looked back. The discontent in the index looks heavy enough to sustain an extended bear market and a long stay in oversold territory. The S&P 500 now needs a 4.4% gain just to challenge the bear market line from current levels.
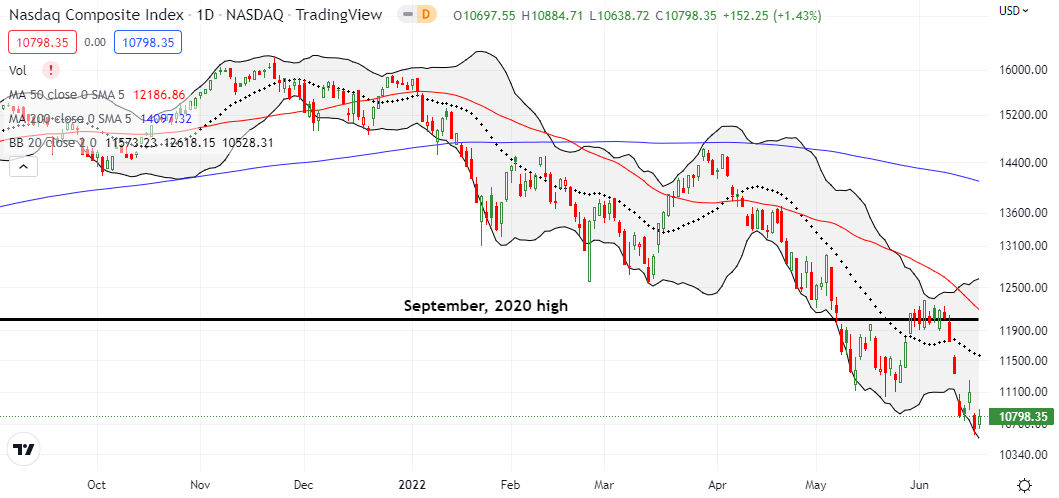
The NASDAQ (COMPQX) is leaving its last important line of resistance far behind. The tech laden index’s declining 50-day moving average (DMA) is about to overtake that line as key resistance. The NASDAQ trades near a 21-month low but the 1.4% gain was enough to allow me to flip a QQQ call that I bought in the depths of Thursday’s extreme 4.0% loss. Like the S&P 500, sellers gapped the NASDAQ down to a new low and just kept pushing prices lower from there.
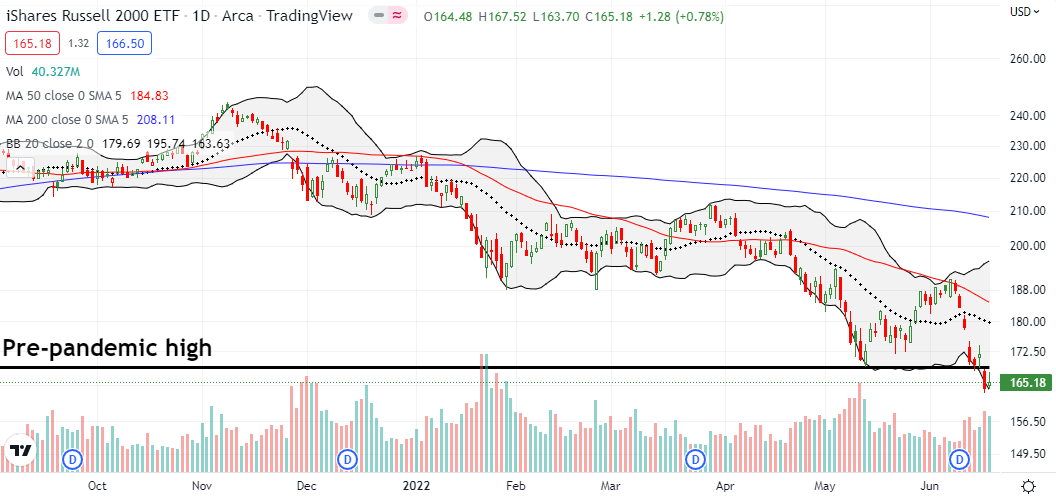
The iShares Russell 2000 ETF (IWM) showed its discontent with a clean break below its pre-pandemic high. Friday’s small rally for the ETF of small caps stopped short of what is now key resistance. IWM closed the week at a 19-month low. The complete loss of pandemic era gains is a red flag signaling a summer of discontent.
Stock Market Volatility
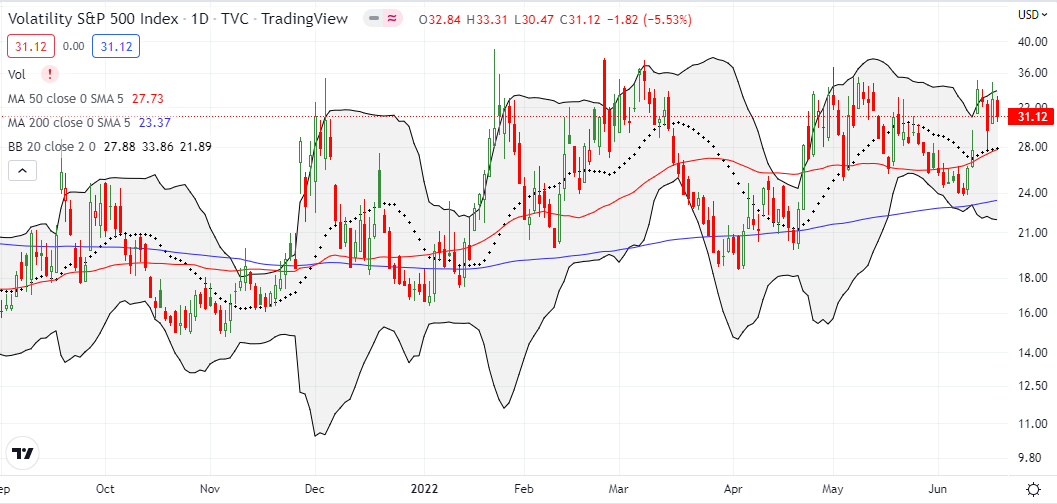
Despite the week’s discontent, the volatility index (VIX) stayed true to overhead resistance. On Thursday, I tested this behavior with a purchase of shares in ProShares Short VIX Short-Term Futures ETF (SVXY). I promptly flipped the shares for a small gain on Friday. I will feel much more comfortable buying SVXY after an extreme upward surge in the VIX above the recent highs.
The Short-Term Trading Call With A Summer of Discontent
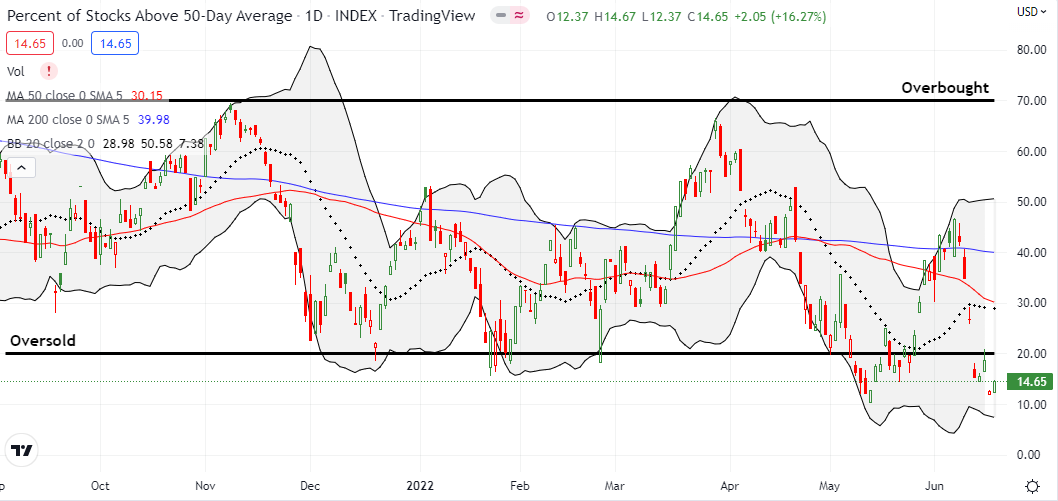
- AT50 (MMFI) = 14.7% of stocks are trading above their respective 50-day moving averages (oversold day #5)
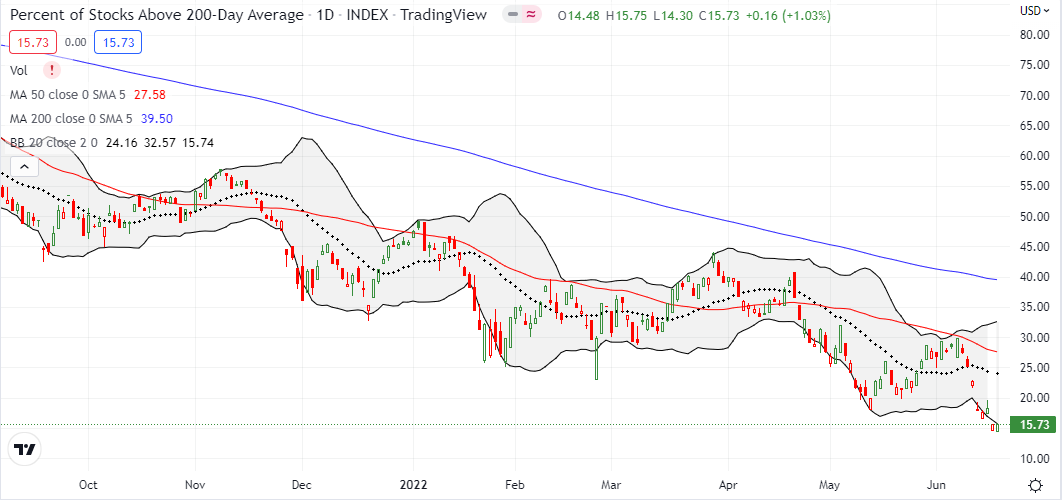
- AT200 (MMTH) = 15.7% of stocks are trading above their respective 200-day moving averages
- Short-term Trading Call: cautiously bullish
AT50 (MMFI), the percentage of stocks trading above their respective 50DMAs, collapsed on Thursday down to 11.7% at its lows. My favorite technical indicator meekly bounced to 12.6% at Thursday’s close. AT50 ended the week at 14.7%. Deepening technical damage has me bracing for a summer of discontent. My short-term trading call remains at cautiously bullish given the oversold conditions, but my upside expectations are VERY subdued. The coming summer of discontent will make investible stocks even more difficult to find. The likely churn will test everyone’s patience.
In anticipation of a short-term oversold bounce, I got incrementally more aggressive with bullish trades while maintaining my few bearish (hedges). I added calls and call spreads in the likes of KraneShares CSI China Internet ETF (KWEB), more ARK Fintech Innovation ETF (ARKF), and the VanEck Semiconductor ETF (SMH).
Speaking of discontent, Cathie Wood tweeted out more scolding for the stock market and individual investors who are getting comfortable with their risk aversion. Calling this desire to stay conservative amidst turmoil “the most egregious misallocation of capital in history” is the very definition of an extreme statement. I get more and more interested in following Wood because she and the ARK team are amazingly sanguine even as the ARK funds get ever closer to wiping out all their pandemic era gains. Any major shift in sentiment from ARK will be a momentous market event.
Be careful out there!
Footnotes
“Above the 50” (AT50) uses the percentage of stocks trading above their respective 50-day moving averages (DMAs) to measure breadth in the stock market. Breadth defines the distribution of participation in a rally or sell-off. As a result, AT50 identifies extremes in market sentiment that are likely to reverse. Above the 50 is my alternative name for “MMFI” which is a symbol TradingView.com and other chart vendors use for this breadth indicator. Learn more about AT50 on my Market Breadth Resource Page. AT200, or MMTH, measures the percentage of stocks trading above their respective 200DMAs.
Active AT50 (MMFI) periods: Day #5 under 20% (oversold), Day #6 under 30%, Day #8 under 40%, Day #52 under 50%, Day #57 under 60%, Day #328 under 70%
Source for charts unless otherwise noted: TradingView.com
Full disclosure: long QQQ put spread and calls; long SPY call spread, long IWM call spread
FOLLOW Dr. Duru’s commentary on financial markets via StockTwits, Twitter, and even Instagram!
*Charting notes: Stock prices are not adjusted for dividends. Candlestick charts use hollow bodies: open candles indicate a close higher than the open, filled candles indicate an open higher than the close.

