Stock Market Commentary
The major indices enjoyed important rebounds last week. Despite this summer of discontent, buyers managed to follow through on the previous week’s test of the oversold threshold. The gains are yet another testament to the opportunities in oversold trading conditions. The rebound was strong enough to push market breadth to new heights even as all the major indices stare down heavy resistance levels. Consistent with bear market action, the market has been failing big tests. This big test comes with another earnings seasons launching and an important reading on the CPI (consumer price index) on Wednesday. The market’s reactions to these catalysts should reveal the underlying health of this bounce from oversold conditions.
The Stock Market Indices
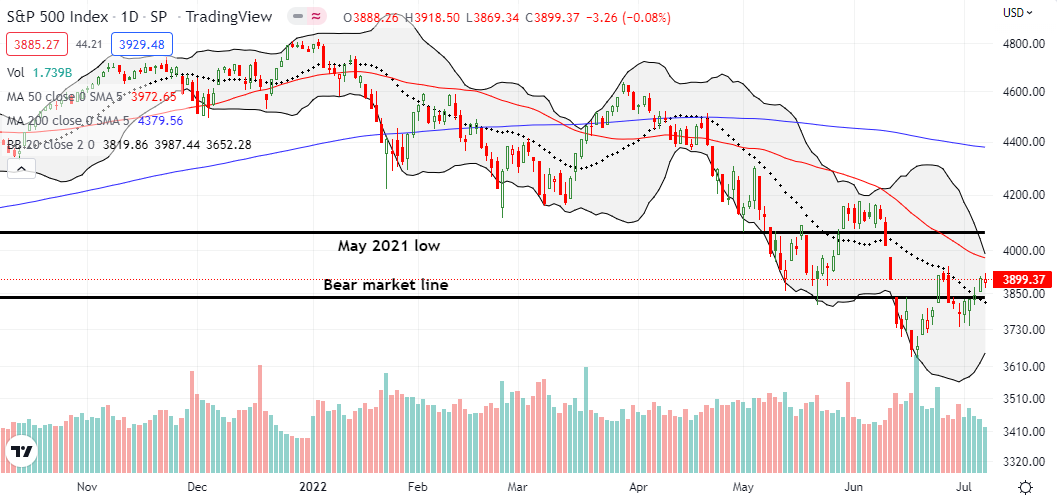
The S&P 500 (SPY) crawled its way out of bear market territory for the second time in less than a month. The first breakout looked impressive with strong trading volume and a 3.1% gain. The second breakout happened in the middle of low and declining volume (see the green and red bars at the bottom of the chart) and a 1.5% gain. Thus, the S&P 500 looks too tentative to generate enough momentum to punch through resistance at the 50-day moving average (DMA) (the red line below). In a bear market, buyers have to apply extra force to make a lasting point.
Still, the week’s move took me out of my SPY calendar spread at its initial profit target. I still have a $385/$392 call spread expiring on Wednesday.
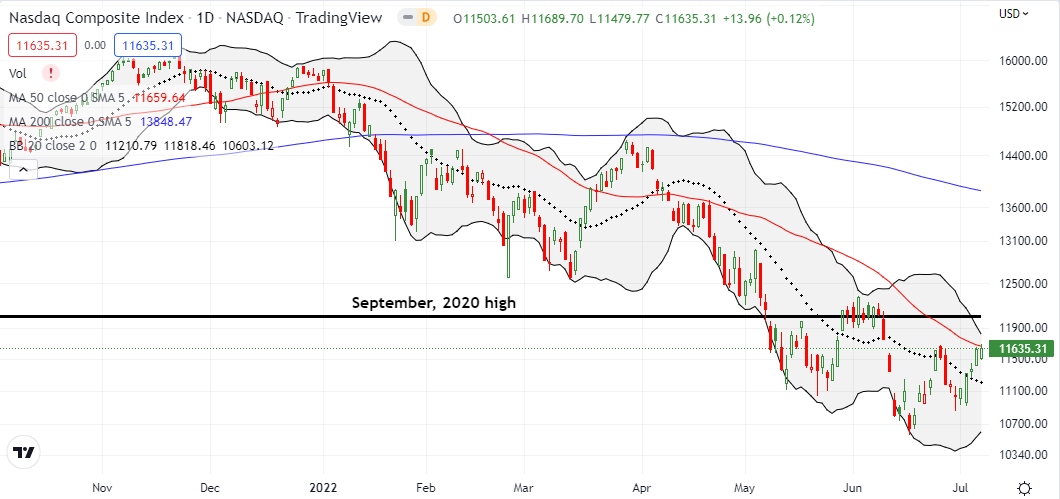
The NASDAQ (COMPQ) printed gains 5 days in a row. Not only is this milestone a first for the bear market in high tech, but also the last such streak happened across last October and November on the way to the NASDAQ’s all-time high. In other words, this big test at 50DMA resistance has double significance.
I took profits on my QQQ $287/$294 call spread. With an expiration in a week, risk/reward favored taking the profits here and waiting to see what happens next. A 50DMA breakout will leave a sliver of space to play a move to the next resistance at the September, 2020 high.
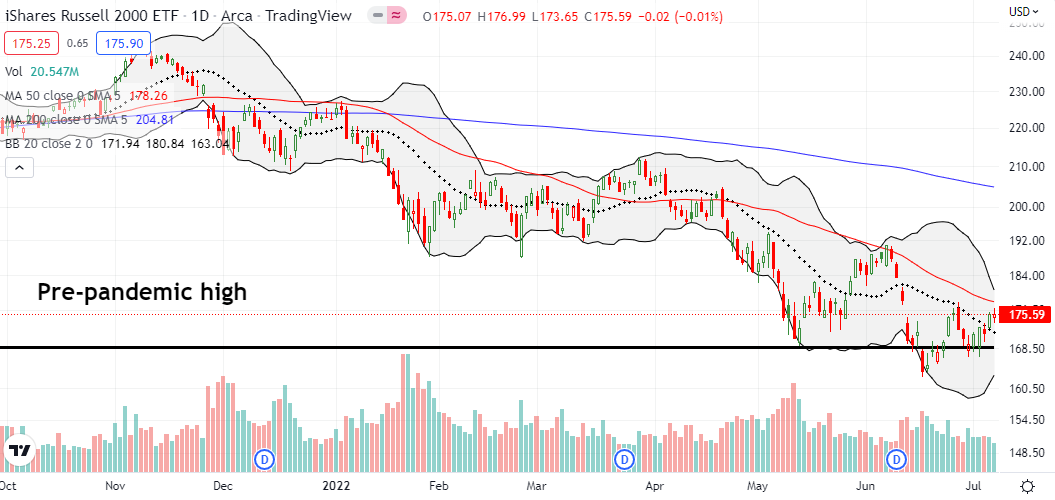
The iShares Russell 2000 ETF (IWM) closed the week right at its former high. I flipped a call spread the previous week. My next (bullish) move will come on a confirmed 50DMA breakout.
Stock Market Volatility
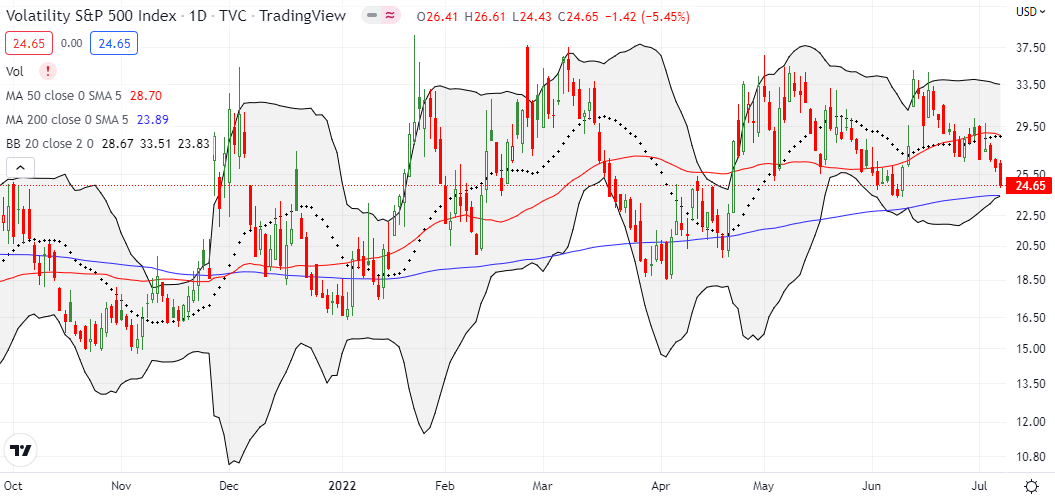
The volatility index (VIX) suffered a big fade from intraday highs to start the week and spent the remaining days of the week falling. The VIX closed just above its June lows in another sign that the summer of discontent is on slow motion for now. A breakdown below June’s low gets me bullish enough to anticipate success for the big test of the summer of discontent.
The Short-Term Trading Call With the Big Test
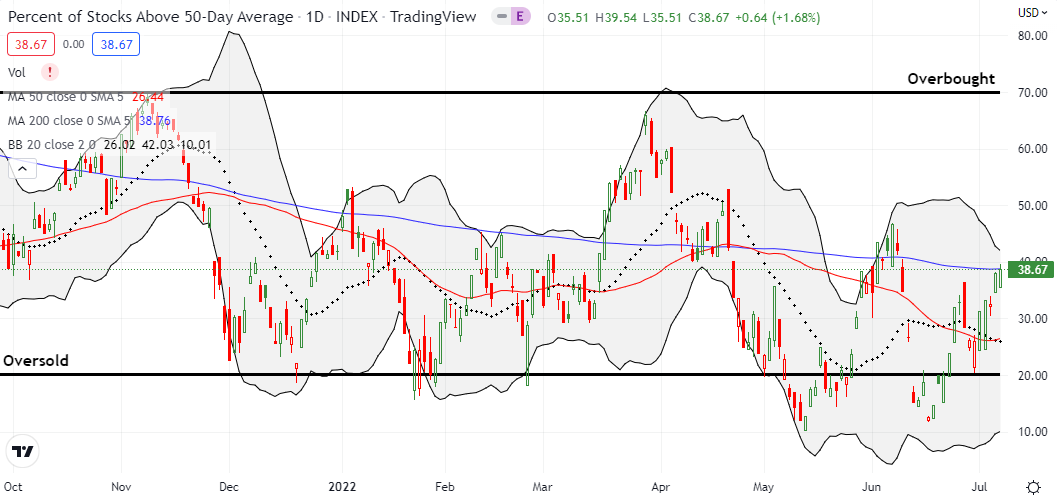
- AT50 (MMFI) = 38.7% of stocks are trading above their respective 50-day moving averages
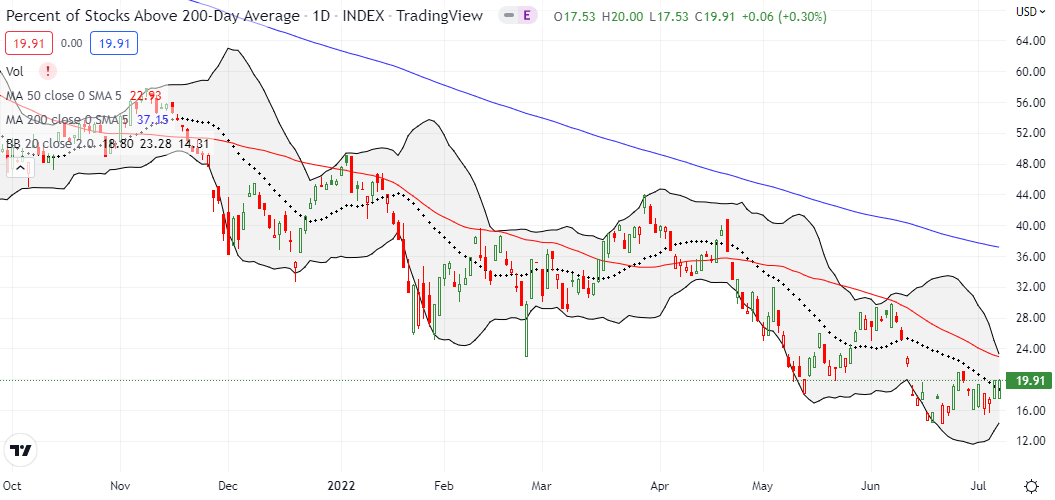
- AT200 (MMTH) = 19.9% of stocks are trading above their respective 200-day moving averages
- Short-term Trading Call: cautiously bullish
AT50 (MMFI), the percentage of stocks trading above their respective 50DMAs, closed at a one month high. AT50’s streak higher provides an even more encouraging picture of the stock market’s current health than the major indices. I daresay there is even a better than 50/50 chance that the indices can soon power through resistance even with sluggish trading volumes. However, this is far from a time to celebrate. Buyers must still prove themselves by conquering the big test of overhead resistance. I provided examples of what success looks like with individual stocks in “Stock Chart Reviews – Bear Market Green Shoots.”
In the meantime, I look back on the chart of AT50 and am once more impressed by the ability of market breadth to navigate trades. The last oversold period lasted a tough six days, but it ended. So both the aggressive and the conservative AT50 trading rules delivered trading gains at this point…even with a brief test of the oversold threshold. Even during a bear market, stocks cannot stay stuck in extreme conditions. The next question is whether market breadth can summon up just enough fight to print its first higher high since March’s peak.
Be careful out there!
Footnotes
“Above the 50” (AT50) uses the percentage of stocks trading above their respective 50-day moving averages (DMAs) to measure breadth in the stock market. Breadth defines the distribution of participation in a rally or sell-off. As a result, AT50 identifies extremes in market sentiment that are likely to reverse. Above the 50 is my alternative name for “MMFI” which is a symbol TradingView.com and other chart vendors use for this breadth indicator. Learn more about AT50 on my Market Breadth Resource Page. AT200, or MMTH, measures the percentage of stocks trading above their respective 200DMAs.
Active AT50 (MMFI) periods: Day #11 over 20%, Day #5 over 30% (overperiod), Day #21 under 40%, Day #65 under 50%, Day #70 under 60%, Day #341 under 70%
Source for charts unless otherwise noted: TradingView.com
Full disclosure: long QQQ put spread; long SPY call spread
FOLLOW Dr. Duru’s commentary on financial markets via StockTwits, Twitter, and even Instagram!
*Charting notes: Stock prices are not adjusted for dividends. Candlestick charts use hollow bodies: open candles indicate a close higher than the open, filled candles indicate an open higher than the close.

