Stock Market Commentary:
Fears of a recession are running high as the Federal Reserve scrambles to normalize monetary policy. The Fed is racing against an economic clock. It needs to get rates as close to the “neutral rate” as possible before a weakening economy finally forces them to reverse course. The higher the rates when the next easing cycle begins, the more room the Fed has to appease the need of financial markets for easy money. In the meantime, industrial weakness in the form of the hard machinery of the economy is spreading as the Fed’s hawkish pressure succeeds in rapid fashion. The charts below provide a sample of the growing issues and challenges. The technicals provide a map for playing the trends from the bullish or bearish side. Most of these stocks are plays I looked forward to accumulating in an inflationary, strong economic environment. Instead, the dramatic impact of economic fears put me on a cautionary pause.
Stock Chart Reviews – Below the 50-day moving average (DMA)
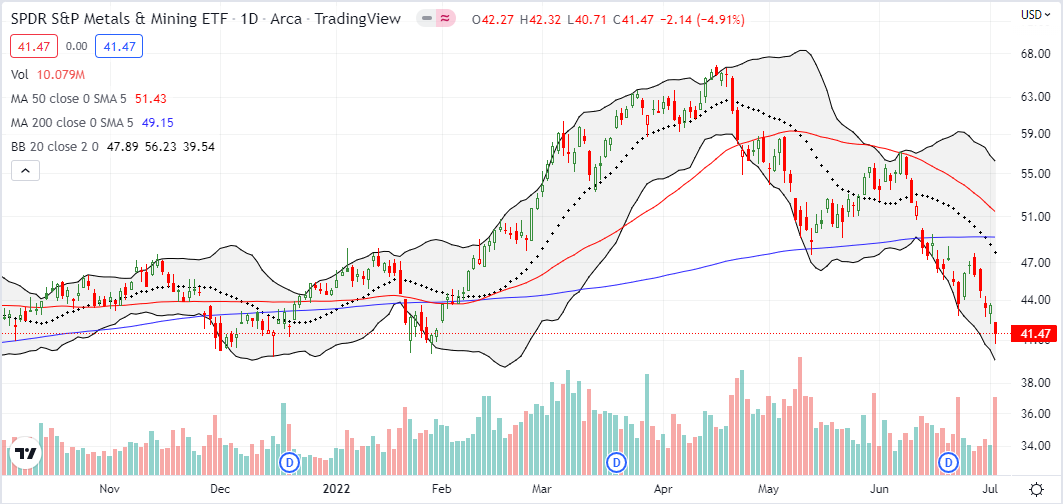
SPDR S&P Metals & Mining ETF (XME)
SPDR S&P Metals & Mining ETF (XME) was a favorite trade for me on the industrial economy. May’s picture-perfect bounce from support at the 200-day moving average (DMA) (the blue line below) was golden. However, since subsequently failing at declining 50DMA resistance (the red line below), XME has traded in bear market mode. June’s 200DMA breakdown and tepid relief rally have taken XME right back to 2022 lows. The good news: if XME closes above today’s high, the ETF sets up for a fresh relief rally back to 20DMA resistance (the dotted line) with support extending to May, 2021 holding yet again.
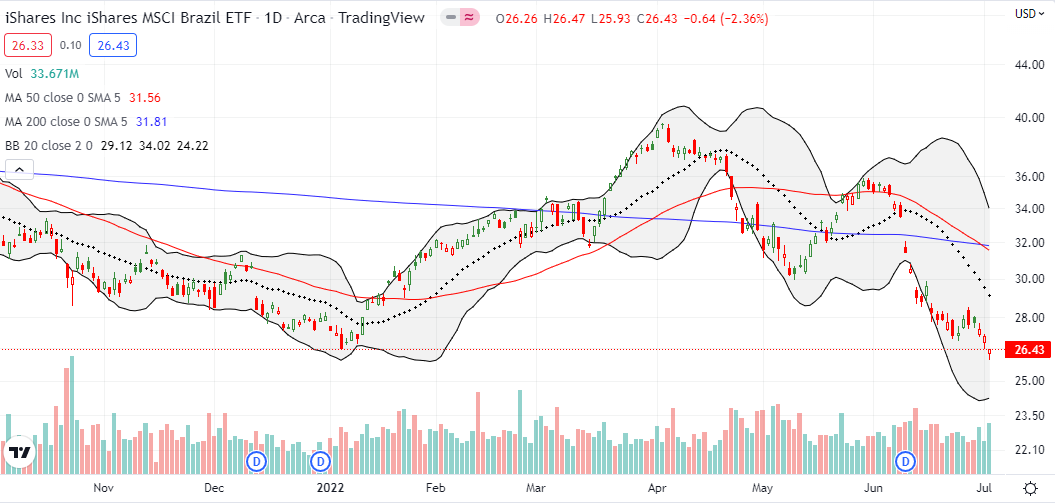
iShares MSCI Brazil ETF (EWZ)
The “20% rule” triggered for the iShares MSCI Brazil ETF (EWZ). I buy EWZ automatically on these corrections no matter the macro environment. I make a move with the expectation that in due time Brazil’s industrial strength will exert itself in a fresh rally. For now, industrial weakness has EWZ clinging for dear life to support from the January, 2022 low.
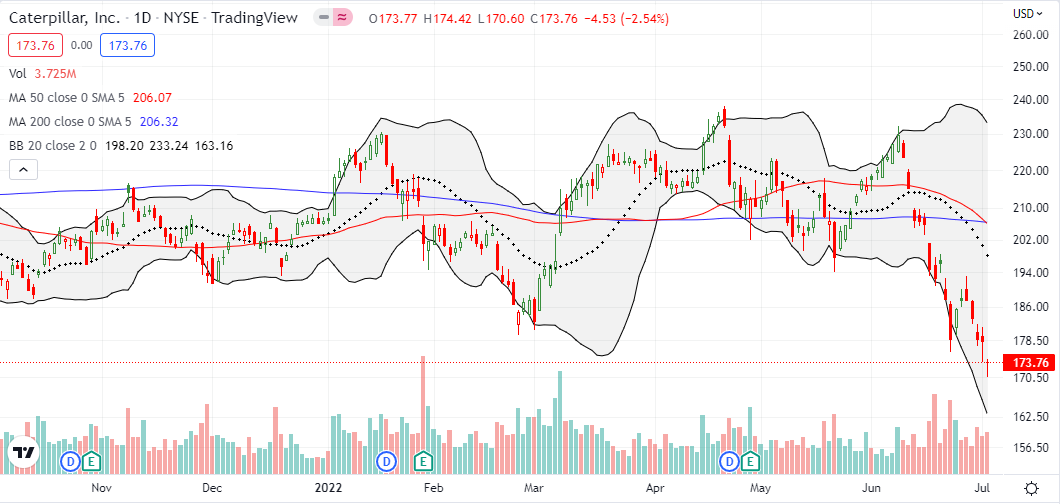
Caterpillar Inc. (CAT)
Caterpillar Inc (CAT) used to serve me well as an economic indicator and a hedge on bullishness. Once CAT went into a wide trading range after hitting its all-time high 13 months ago, I slowly but surely lost interest. Now, CAT has fallen to prices last seen December, 2020. With industrial weakness, CAT is set up for further declines to around $150 where the stock peaked just ahead of the onset of the COVID-19 pandemic. A strong U.S. dollar will also pressure CAT’s international sales.
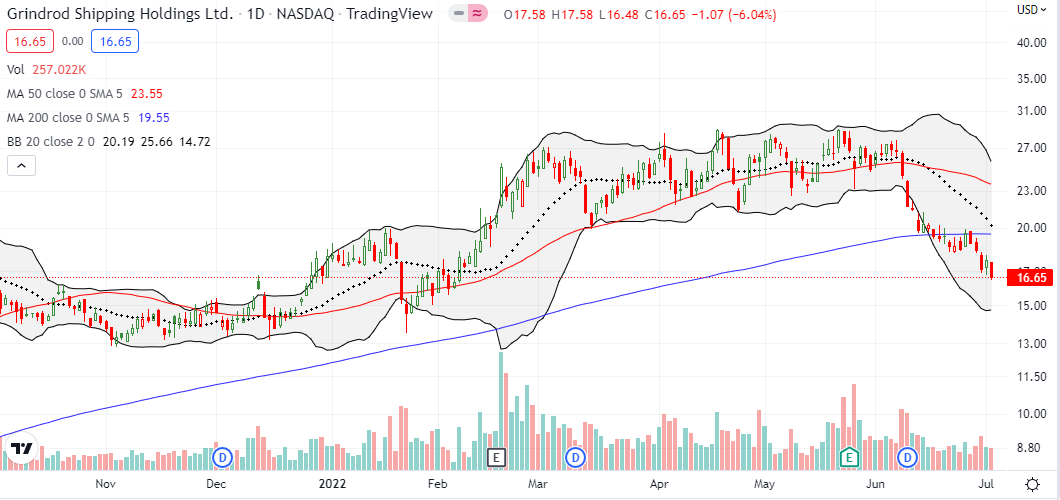
Grindrod Shipping Holdings Ltd (GRIN)
Grindrod Shipping Holdings Ltd (GRIN) was one of the last stocks I held still in an uptrend. Accordingly, I kept a close eye on it once it lost upward momentum. The confirmed 50DMA breakdown in June convinced me to lock in profits. GRIN has continued to sell-off since then. Industrial weakness means lower shipping activity and lower prices. When investors sour on these stocks, the selling can unfold sharply and swiftly. Thus, I treat a confirmed 200DMA breakdown as a very bearish sign for GRIN. Note that the stock traded as low as $2 in the pandemic-driven trough. It was quite a run.
ZIM Integrated Shipping Services Ltd (ZIM)
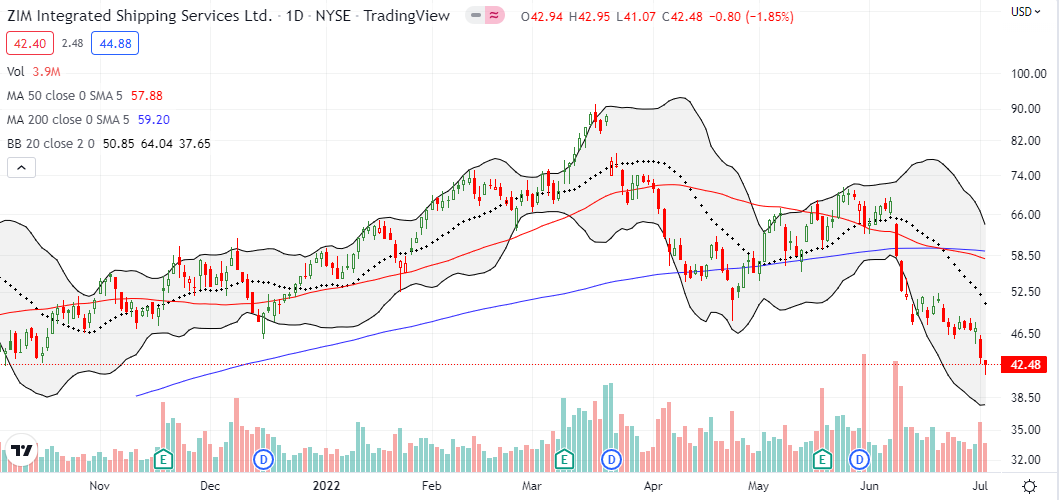
Somehow, ZIM Integrated Shipping Services Ltd (ZIM) was one of the few IPOs I was able to snag back when IPOs were hot. ZIM nearly doubled within the first month of trading. I thought I was golden and took profits. ZIM went on to soar another 4x before finally peaking in March.
Like GRIN, ZIM suffered a bearish 200DMA breakdown last month. Because of the persistent rally, ZIM has little support if it breaks below $35 where it dipped to a bottom during the run-up.
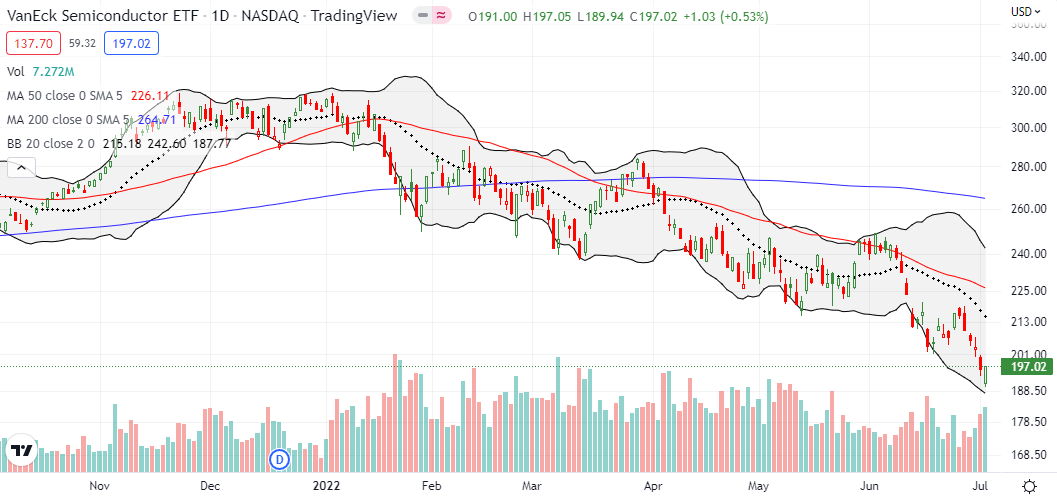
VanEck Semiconductor ETF (SMH)
I bought a VanEck Semiconductor ETF (SMH) call spread for a bounce of the 2022 lows. That bounce never came. Sellers have taken SMH down to prices last seen November, 2020. I think these prices are a steal but industrial weakness and previous losses are cooling my heels. I now see little point in swinging for SMH again until a confirmed 50DMA breakout (or deeply oversold conditions in the stock market).
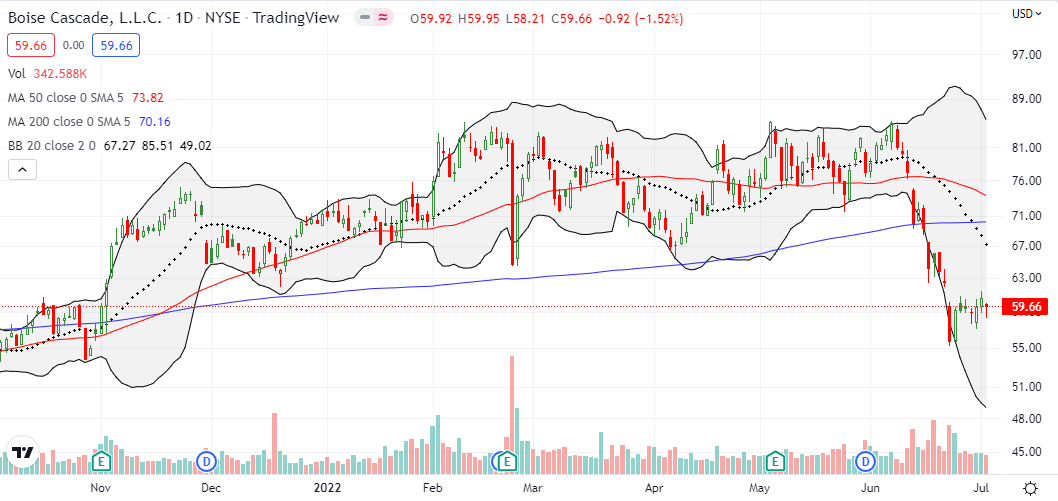
Boise Cascade Co. (BCC)
Boise Cascade Co (BCC) is a good industrial type stock with its specialty in the paper products used to ship goods all over the planet. Just a month ago I pointed to BCC’s good fortunes as a sign of a healthy economy. Weeks of selling later and suddenly BCC is a warning sign of industrial weakness. The bearish 200DMA breakdown conveniently coincides with and confirms the end of uptrends for the shippers GRIN and ZIM. BCC is now clinging to the bottom of its breakout in November. I am watching closely, but I do not see a near-term (bullish) entry point.
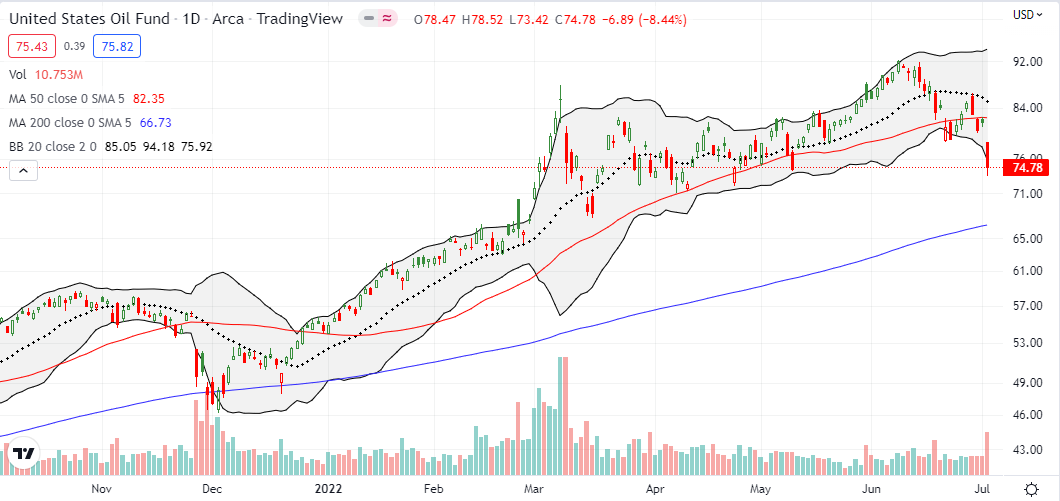
United States Oil ETF (USO)
Oil, and energy in general, has been a big story in 2022. Ironically, I started the previous two years declaring the start of bullish runs in oil. The third time would have been a charm if I decided to swing one more time! Now, oil prices are finally breaking down from an overheated pace. The United States Oil ETF (USO) confirmed a 50DMA breakdown and looks set to test 200DMA support.
On June 18th I sent this photo to friends calling for a top in gasoline prices. I wish I had thought to marry that prediction with USO puts!
Opinions diverge wildly on oil’s trajectory. Goldman has a $145 price target while Citi has a $65 price target. Anything is possible in a highly manipulated market! 🤷♂️
Alcoa Corp. (AA)
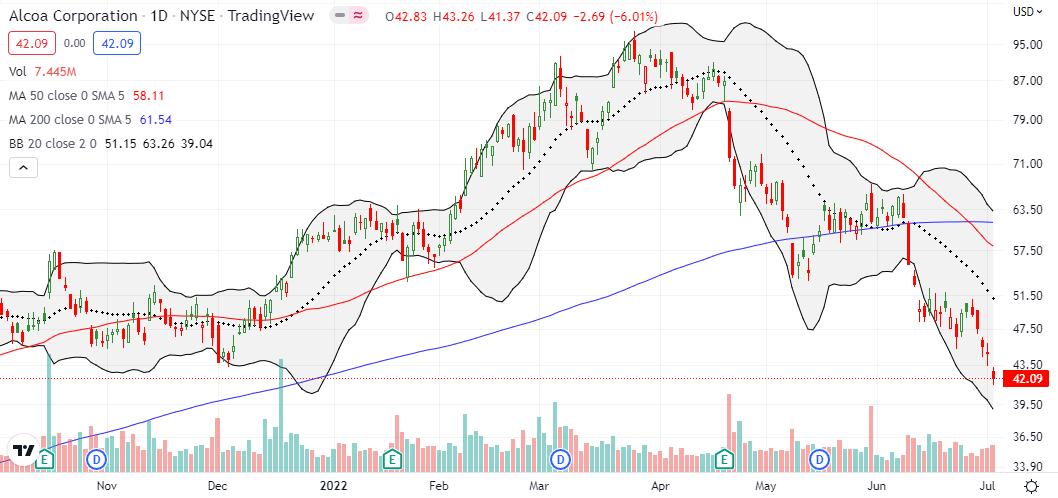
I grew suspicious of aluminum producer Alcoa Corp (AA) after a bearish post-earnings breakdown in April. Subsequently slicing through 200DMA support sealed the deal on my distrust. Industrial weakness has pushed AA all the way down to an 11-month low with no sign of rest for sellers. Of course, looking back, I can see AA was a sufficient signal to get bearish on the industrial/commodities complex.
Stock Chart Reviews – Above the 50DMA
FedEx Corporation (FDX)
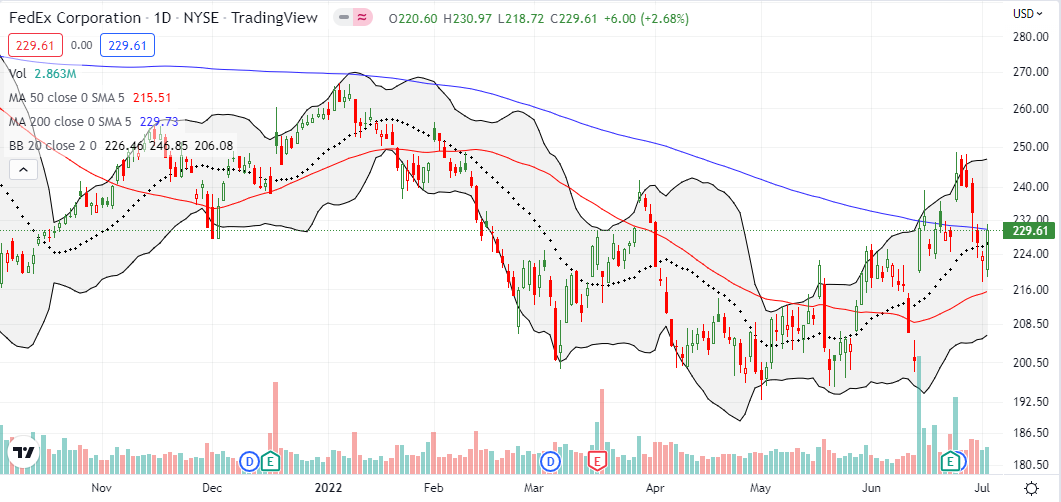
With the market’s low percentage of stocks trading above their respective 50DMAs, it is hard to find stocks in a bullish swing. FedEx Corporation (FDX) is leaning against industrial weakness with an actual gain in June that includes a post-earnings 200DMA breakout. While sellers successfully reversed those gains, today’s 2.7% rebound provides a glimmer of hope that 50DMA support can hold. I am a buyer with a fresh close above the 200DMA.
Be careful out there!
Footnotes
Source for charts unless otherwise noted: TradingView.com
Full disclosure: long EWZ
FOLLOW Dr. Duru’s commentary on financial markets via StockTwits, Twitter, and even Instagram!
*Charting notes: Stock prices are not adjusted for dividends. Candlestick charts use hollow bodies: open candles indicate a close higher than the open, filled candles indicate an open higher than the close.


Be careful of things like AA – the war in Ukraine is a major factor in the aluminum market, but with a long delay as massive inventories are slowly depleted.
Be careful shorting? I would almost never short commodity-related stocks in an environment where over the long haul the Fed is biased toward easy money. I’ll keep my eye out for the technical turn!