Stock Market Commentary:
A little over a month ago, the prospects of a bottom for this bear market got me a little more interested in individual stocks. Unfortunately, the bear market rubble expanded shortly after that. Amid the rubble are crushed gems and false hopes. These stock charts follow up on my initial reads and provide signals for identifying the next window of opportunity.
Stock Chart Reviews – Below the 50-day moving average (DMA)
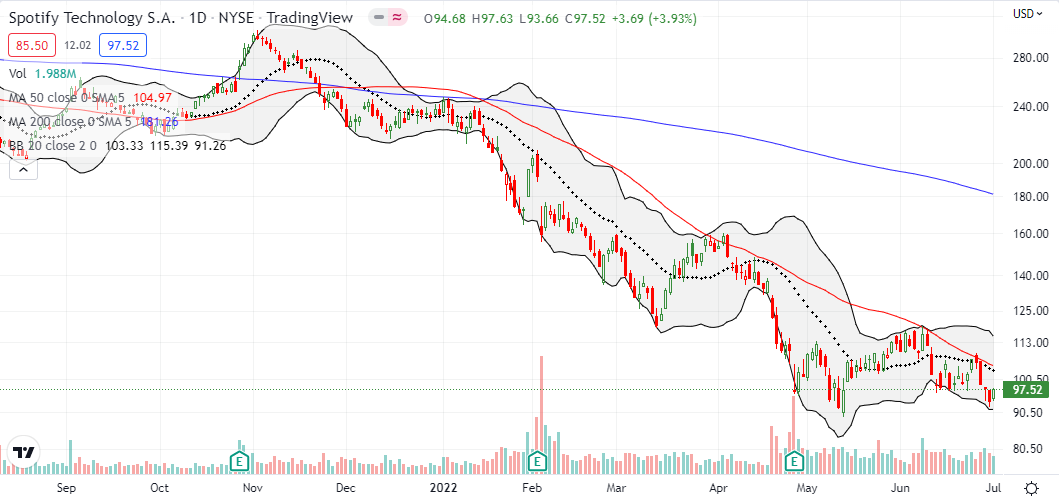
Spotify Technology (SPOT)
After suffering a 12.4% post-earnings loss, audio streaming platform Spotify Technology (SPOT) was making a quiet comeback. Overhead resistance at the 50-day moving average (DMA) (the red line below) was not impressed. Several challenges and attempts to break out have failed over the last month. Now, SPOT is fortunate just to cling to its May low as support. A further breakdown would open the gates for much deeper losses. With this context, a confirmed 50DMA breakout for SPOT should be a very bullish event.
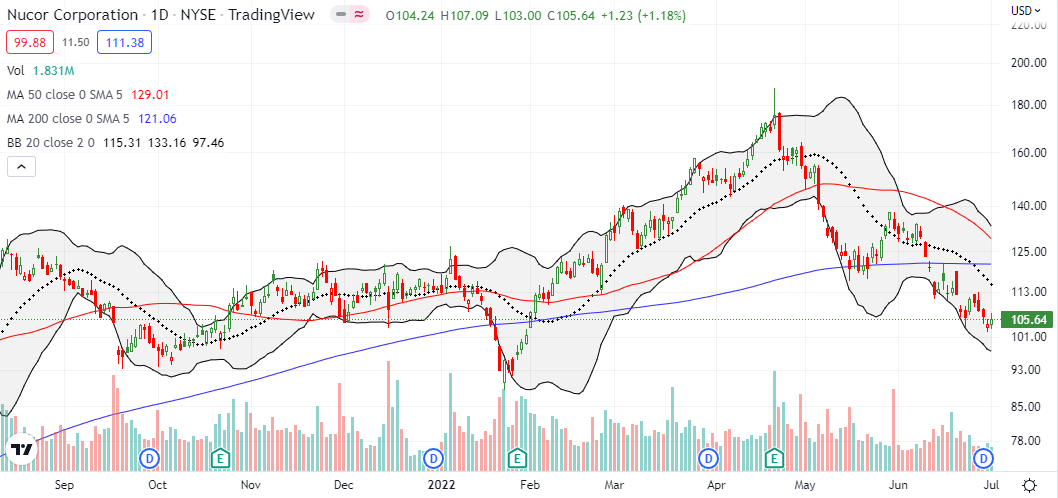
Nucor Corp. (NUE)
April’s post-earnings blow-off top looks even more ominous for steelmaker Nucor Corp (NUE). Last month, I looked at the successful defense of 200DMA support (the blue line below) as a sign of optimism. Instead, NUE soon suffered a bearish 200DMA breakdown. The resulting (short-term) downtrend continued with last week’s trading.
As I noted in the original post, the blow-off top is particularly potent given the bullish context of Nucor’s guidance: “We expect that the second quarter of 2022 will be the most profitable quarter in Nucor’s history, surpassing the previous record set in the fourth quarter of 2021.” The 200DMA breakdown confirms that the market thinks these results will be as good as it gets for this crushed gem for some time.
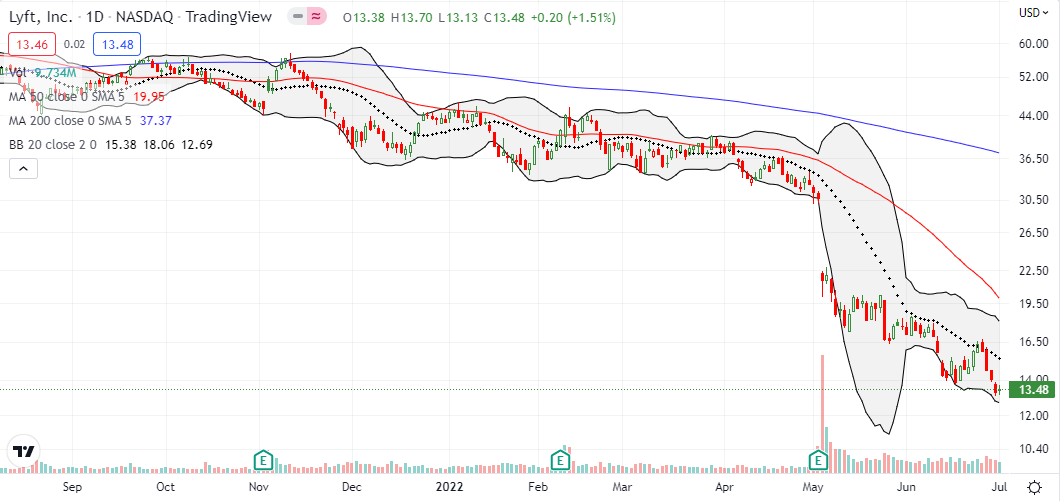
Lyft, Inc (LYFT)
The Bollinger Band (BB) squeeze for ride-sharing company Lyft, Inc (LYFT) resolved to the downside. No false hopes here. LYFT just followed through with an on-going downtrend. Last week delivered another all-time low.
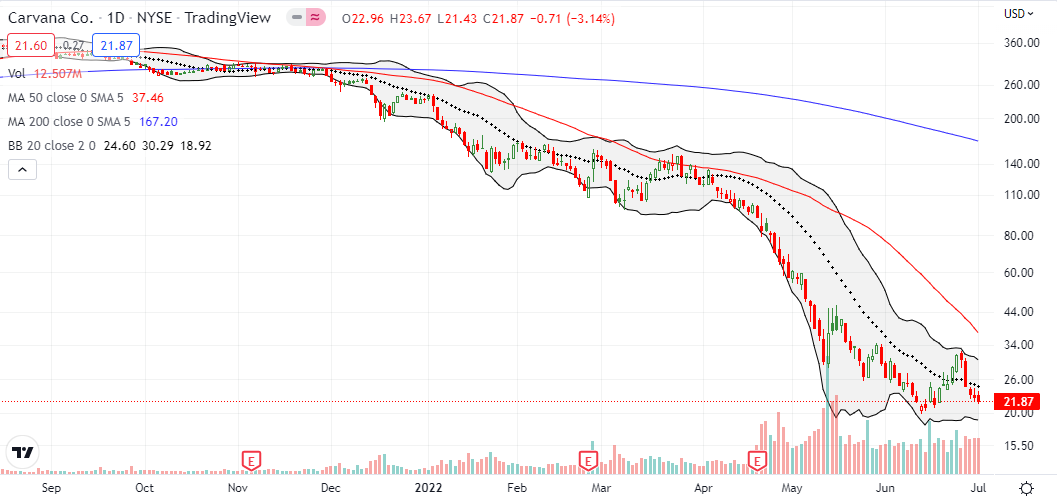
Carvana Co. (CVNA)
A month ago, online used car company Carvana Co. (CVNA) precariously sat right at its May low. From there, the stock proceeded to set new 4+ year lows. A subsequent relief rally launched CVNA over its downtrending 20DMA. Now the stock looks set to print fresh 4+ year lows.
Prior insider buying in CVNA seems nearly irrelevant now. The false hopes represented by those purchases join the false hopes long left behind in CVNA.
BHP Group Limited (BHP)
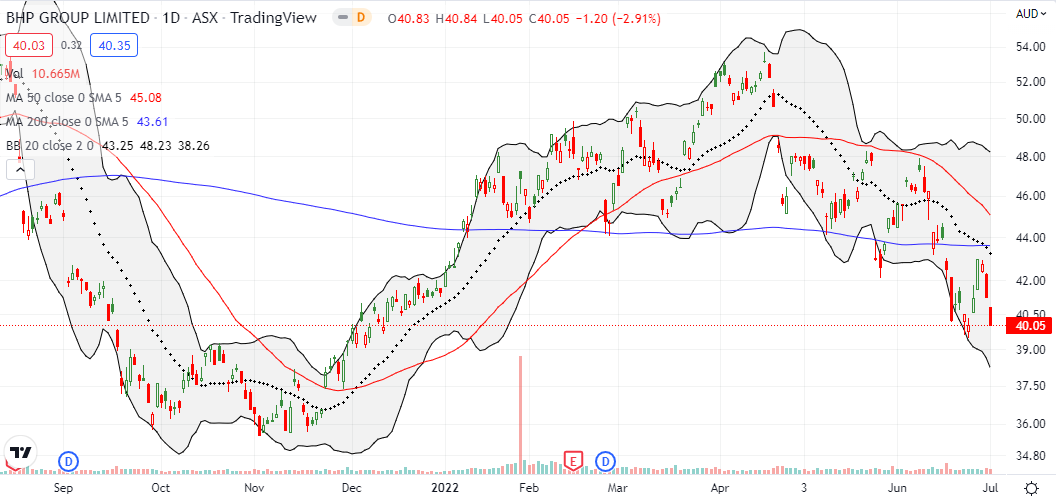
The 200DMA failed to hold as approximate support for diversified commodities producer BHP Group Limited (BHP). I waited to buy into the support until after BHP confirmed a 50DMA breakout. BHP proceeded to rally right into its 50DMA and failed at resistance. The subsequent 200DMA breakdown and last week’s confirmation of 200DMA resistance puts BHP at risk of eventually testing its November, 2021 lows. BHP is a crushed gem, so I will look to start buying at the market’s discount if the stock gets as low as last Fall’s lows.
Walmart Inc. (WMT)
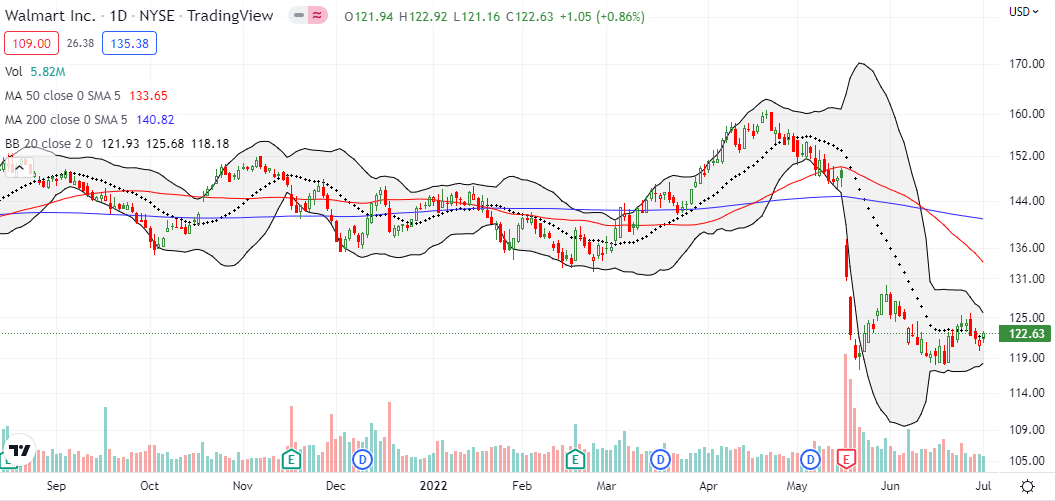
Walmart Inc (WMT) is holding steady after fading its first post-earnings rally. The 20DMA is serving as a pivot for now. As a crushed gem, I will add to my WMT position at significantly lower prices, including fresh speculative trades with call options. With the stock already trading around 2-year lows, the next critical support awaits at the pandemic low around $104.
Nutanix, Inc. (NTNX)
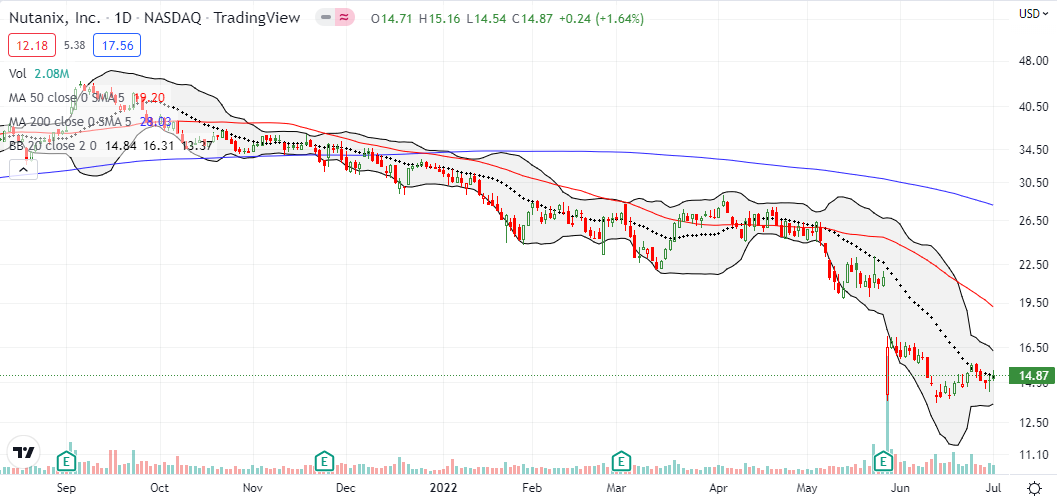
Nutanix, Inc (NTNX) continued lower after June opened in the wake of an earnings disaster. Sellers pushed NTNX all the way back to its post-earnings intraday low before exhausting themselves. Now NTNX leans on its 20DMA resistance. This crushed gem is not showing signs of imminent recovery. Accordingly, I am content waiting until the next earnings round to see whether adding to my position makes any sense in this bear market.
CME Group Inc. (CME)
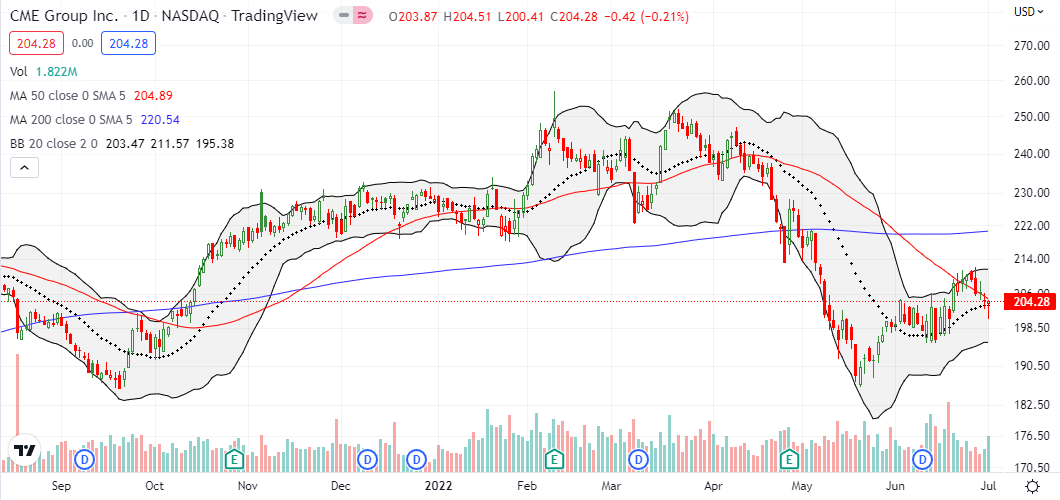
I still expect an exchange like the CME Group Inc (CME) to do well in the frenetic and discontented trading of this bear market. In June, CME outperformed the market with a 3.0% gain for the month. This crushed gem now pivots tentatively around its declining 50DMA. The convergence at the now uptrending 20DMA makes this a critical technical juncture. A push higher from here makes CME a buy even with overhead resistance looming at the 200DMA.
iShares 20+ Year Treasury Bond ETF (TLT)
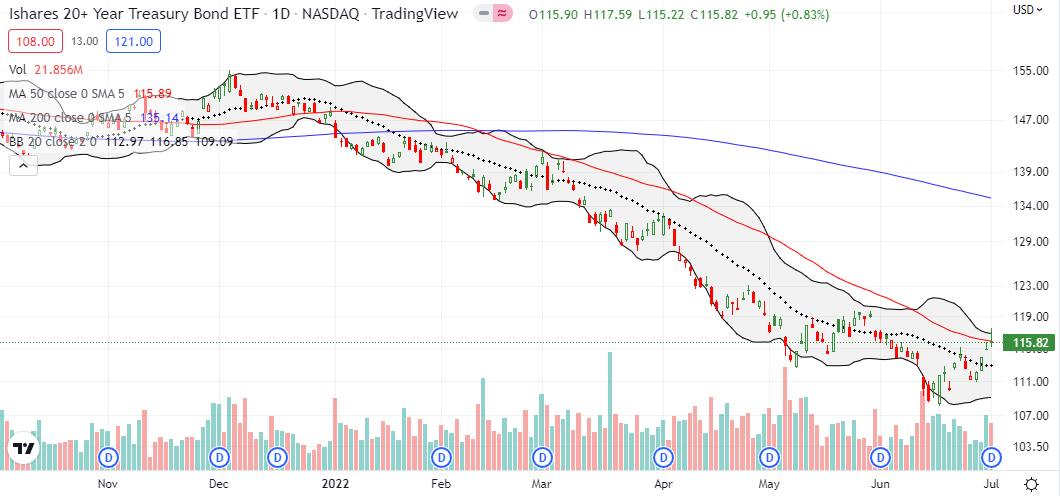
Throughout the downtrend for the iShares 20+ Year Treasury Bond ETF (TLT), I have faded rallies with put options. The current rally back to 50DMA resistance for the first time since March may deliver the demise of this strategy. While TLT failed to break out at the end of last week’s trading, signs are growing that the market is ready to bet on an eventual end to inflation pressures.
TLT’s ride down this year (representing increasing interest rates) engulfed false hopes of transitory inflation, inflation rendered insignificant because of “base effects”, and, the latest hopeful meme, “peak inflation.” So, a breakout here, and especially a breakout above the May highs, could signal a milestone moment. If this counter-trend rally continues into the Federal Reserve’s July meeting, the Fed could even decide it can afford to relax on its aggressive push to normalize monetary policy. Subsequently, asset prices would explode higher in the short-term. All sorts of false hopes would bloom again along with gem pickers (like me) scrambling to pick up the precious pieces!
Corning Inc. (GLW)
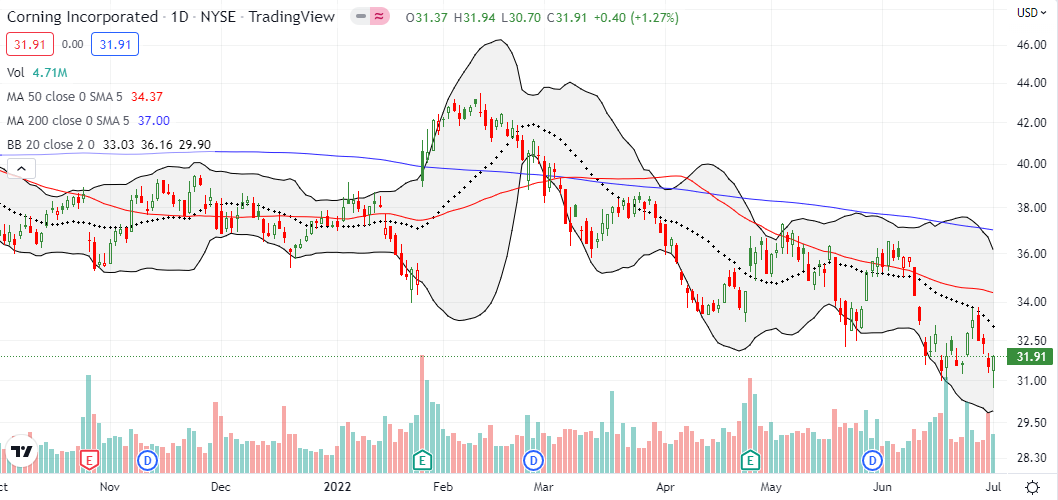
Corning Inc (GLW) is a crushed gem with June’s breakdown ending my expectations for a bear market stabilization. Now, GLW is trying to hold firm to June lows as support.
Dollar Tree, Inc. (DLTR)
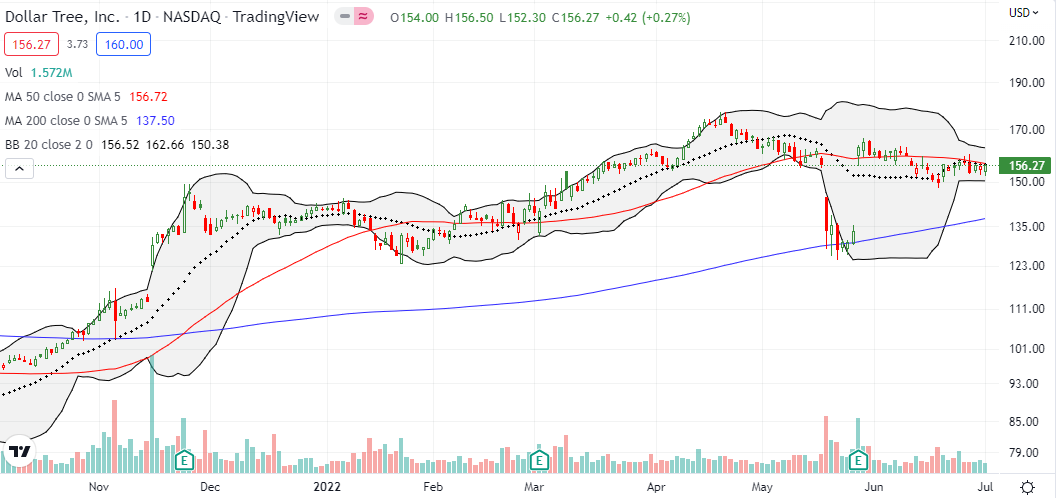
Dollar Tree, Inc (DLTR) has effectively flatlined around its converged 20 and 50DMAs. I am tempted to take profits on my position, but May’s significant rebound off 200DMA support was impressive enough to warrant more patience out of me.
Ulta Beauty, Inc (ULTA)
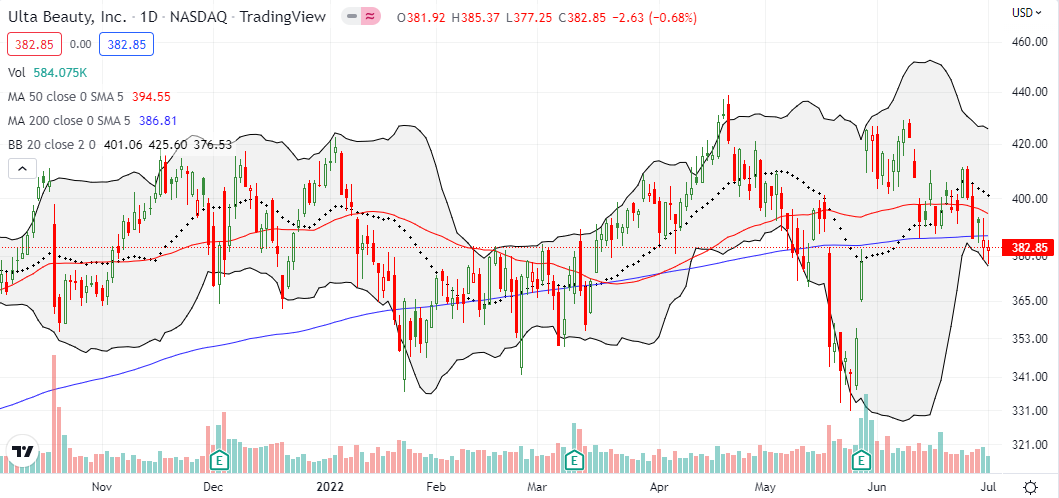
The post-earnings resurgence lasted 3 days for Ulta Beauty, Inc (ULTA). From there, ULTA spent much of June drifting downward. Last week’s confirmed breakdowns delivered a triple threat across the 20, 50, and 200DMAs. I assume this bearish move puts ULTA at risk of eventually reversing all its post-earnings gains. However, a step back shows ULTA swinging through a 110 point trading range for almost a year. Buyers and sellers can stay content trading this range until some convincing catalyst generates a breakout or breakdown from this range.
The Beachbody Company, Inc. (BODY)
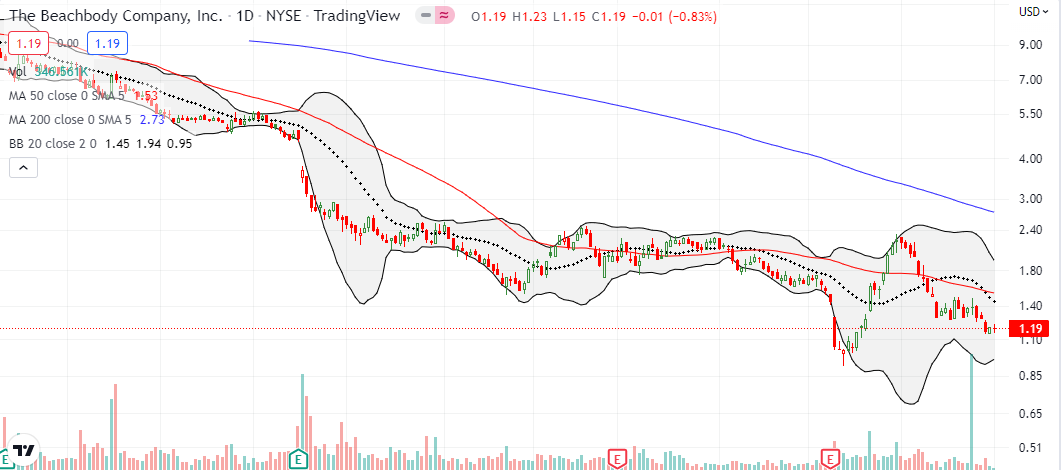
The excitement faded from significant insider buying in The Beachbody Company (BODY). The fresh burst of hope transitioned to a false hope. There is little to do from here besides wait for the positive catalyst that (hopefully) motivated the CEO to load up on his company’s shares.
Stock Chart Reviews – Above the 50DMA
— Nothing!
Be careful out there!
Footnotes
Source for charts unless otherwise noted: TradingView.com
Full disclosure: long BODY, long DLTR, long WMT, long NTNX, long TLT puts
FOLLOW Dr. Duru’s commentary on financial markets via StockTwits, Twitter, and even Instagram!
*Charting notes: Stock prices are not adjusted for dividends. Candlestick charts use hollow bodies: open candles indicate a close higher than the open, filled candles indicate an open higher than the close.

