Stock Market Commentary
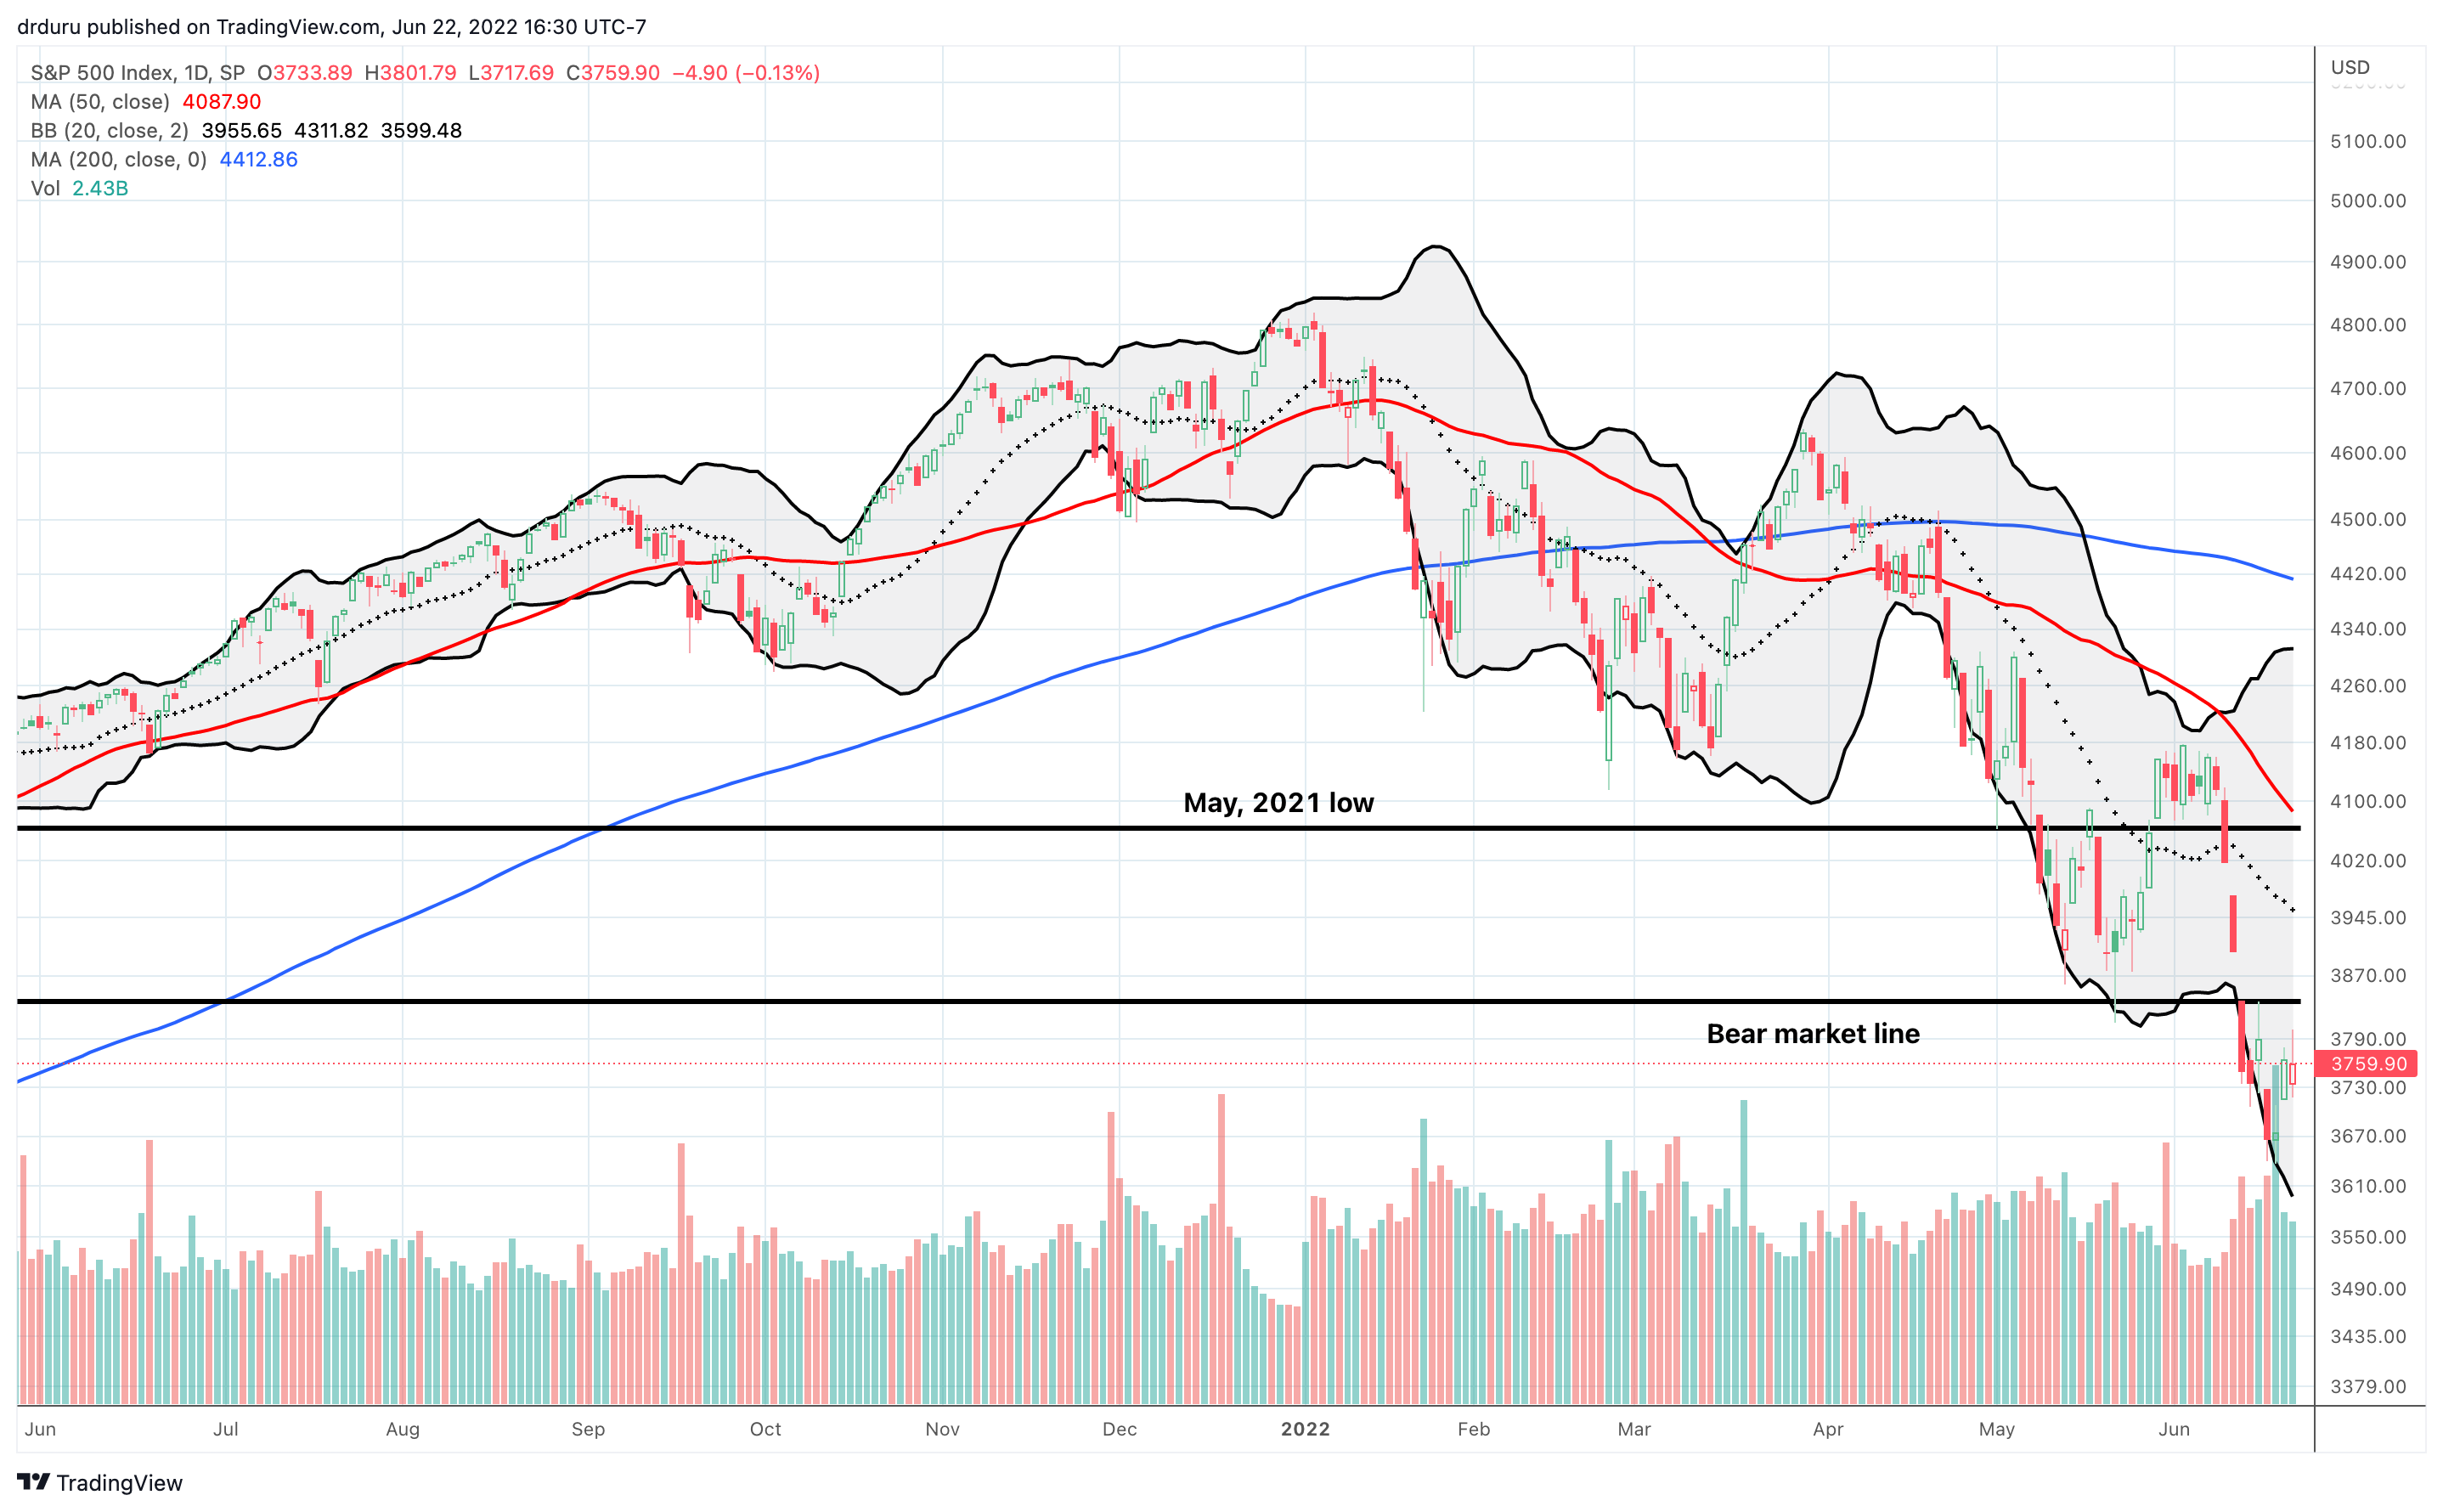
The edginess of the stock market continued this week. After “turnaround Tuesday” delivered broad based gains for the market, Fed Chair Jerome Powell’s testimony in front of Congress produced a familiar fade in the shadow of a bear market. Surprisingly, the buying was enough to end oversold conditions. Yet, the major indices each suffered fades from important bear market lines of resistance. Apparently the market took issue with Powell’s outlook on the prospects for a recession. At least at the end of the day’s session, Powell claimed that the likelihood of a recession is not “elevated”. Powell made it clear that the mission of policy normalization remains undeterred as long as the Fed continues to see unrelenting inflationary pressures.
While the chorus grew slowly coming into this year for the Fed to take inflation more seriously, the Fed’s sudden shift in narrative from transitory inflation is causing growing panic in financial markets. The sell-off into a bear market is just one sign of that growing panic over the prospects of policy normalization. What I will officially call “the Wood indicator” is another sentiment signal.
Cathie Wood, the leader of the ARK funds, is growing increasingly strident in her criticism of the Fed. In a recent tweet thread, Wood criticized the Fed for looking backward at inflation and ignoring forward facing economic risks. Wood has good company in this criticism. However, Wood’s importance comes from the weight her words still carry with retail investors. Cathie Wood is counting on the Fed to stand down in July’s meeting. Such a shift would deliver major vindication and a presumed surge in the most speculative (aka innovative) parts of the stock market where the ARK funds make their living. However, so far, the Fed is showing absolutely zero interest in showing a change in heart anytime soon. So as the clock winds down to July, I expect calls for the Fed to cry uncle to grow ever louder.
Lori Calvasina, head of U.S. equity at RBC Capital Markets, is another strategist counting on the Fed to reverse course soon. She has an extremely bullish 4700 price target for the S&P 500 by the end of 2022.
The Stock Market Indices
The bear market shadow continues to loom large over the S&P 500 (SPY). After an impressive 2.5% oversold bounce on Tuesday, the index tried to follow through today. The intraday high stopped just short of the bear market line. Subsequently, a fade took the index to a 0.1% loss. The summer season is just getting started but the current churn looks like a microcosm of a summer of discontent.
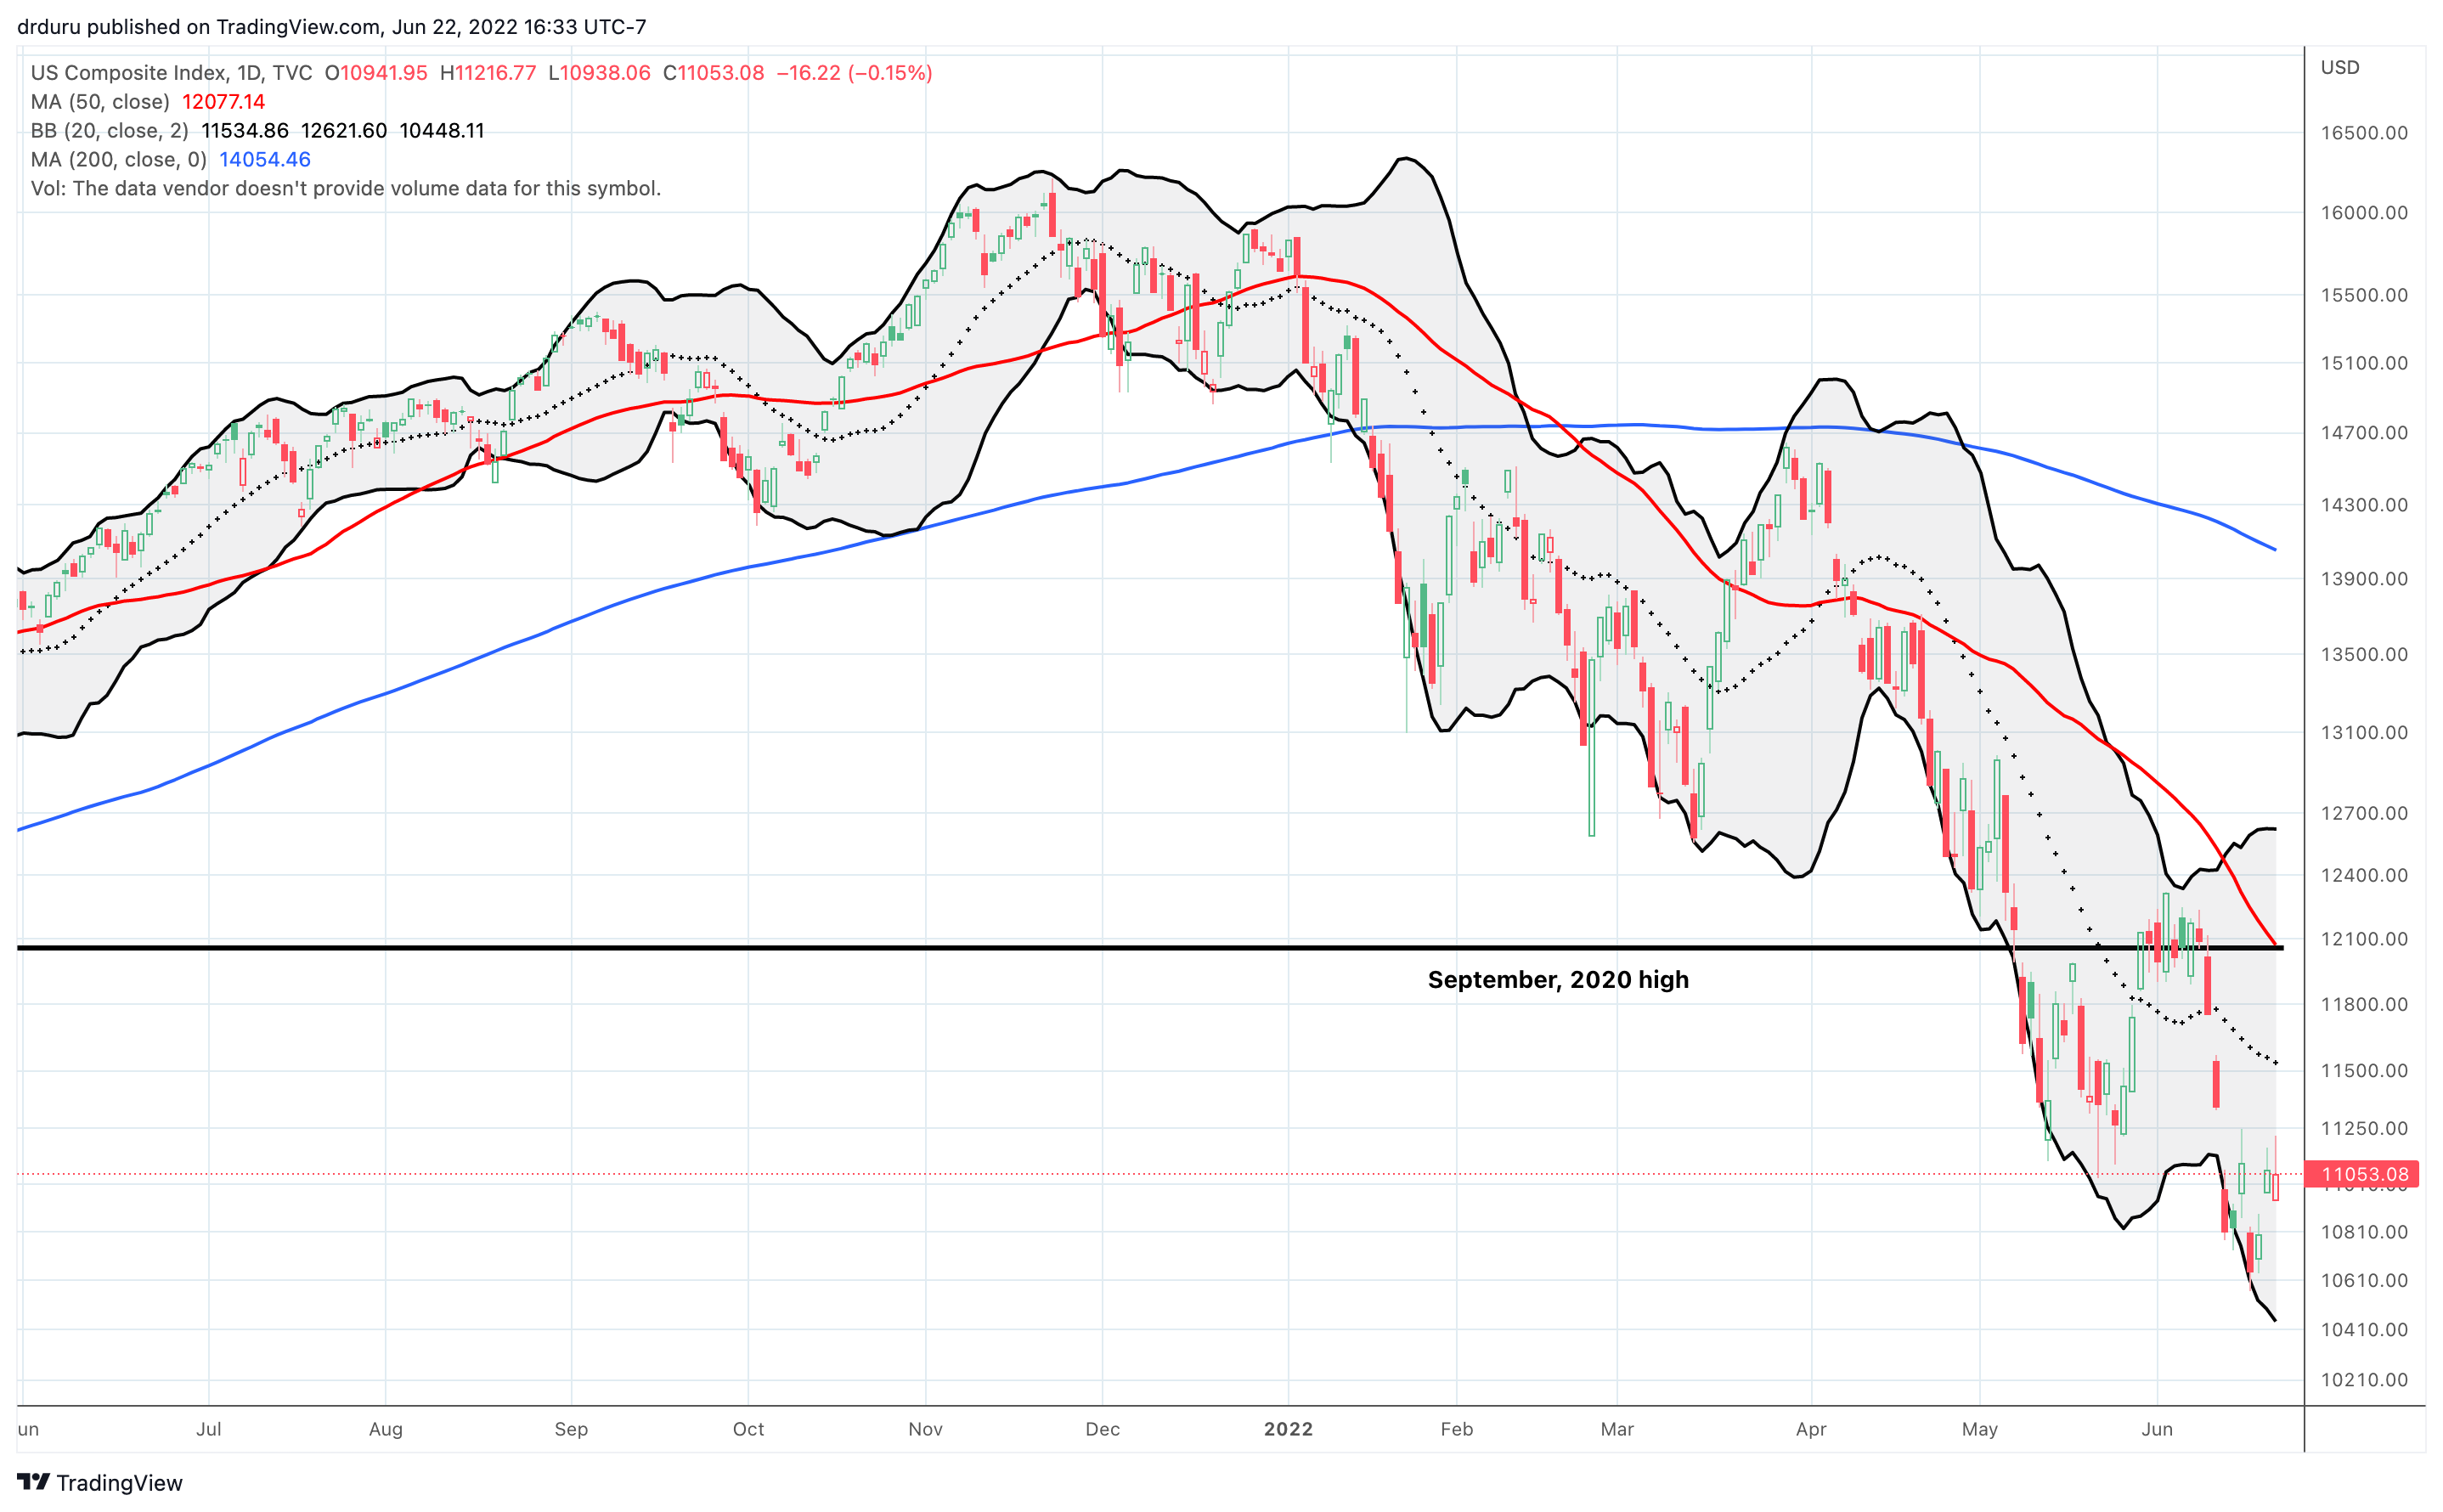
The NASDAQ (COMPQX) is contending with its intraday low from May just above the 11,000 level and with the May closing low at 11,250. The tech-laden index surged 2.5% on Tuesday and tried to break out above the 11,000 ceiling. The NASDAQ got as far as the May closing low which forms a thick bear market shadow right now. At that point, the fade that took down stocks brought the NASDAQ back down to a 0.2% loss. The more the NASDAQ fails at this resistance level, the higher the odds of breaking the June low before a breakout above the May closing low. My QQQ calendar call hit its initial profit target on Tuesday. I will not recharge QQQ calls until the next big move up or down.
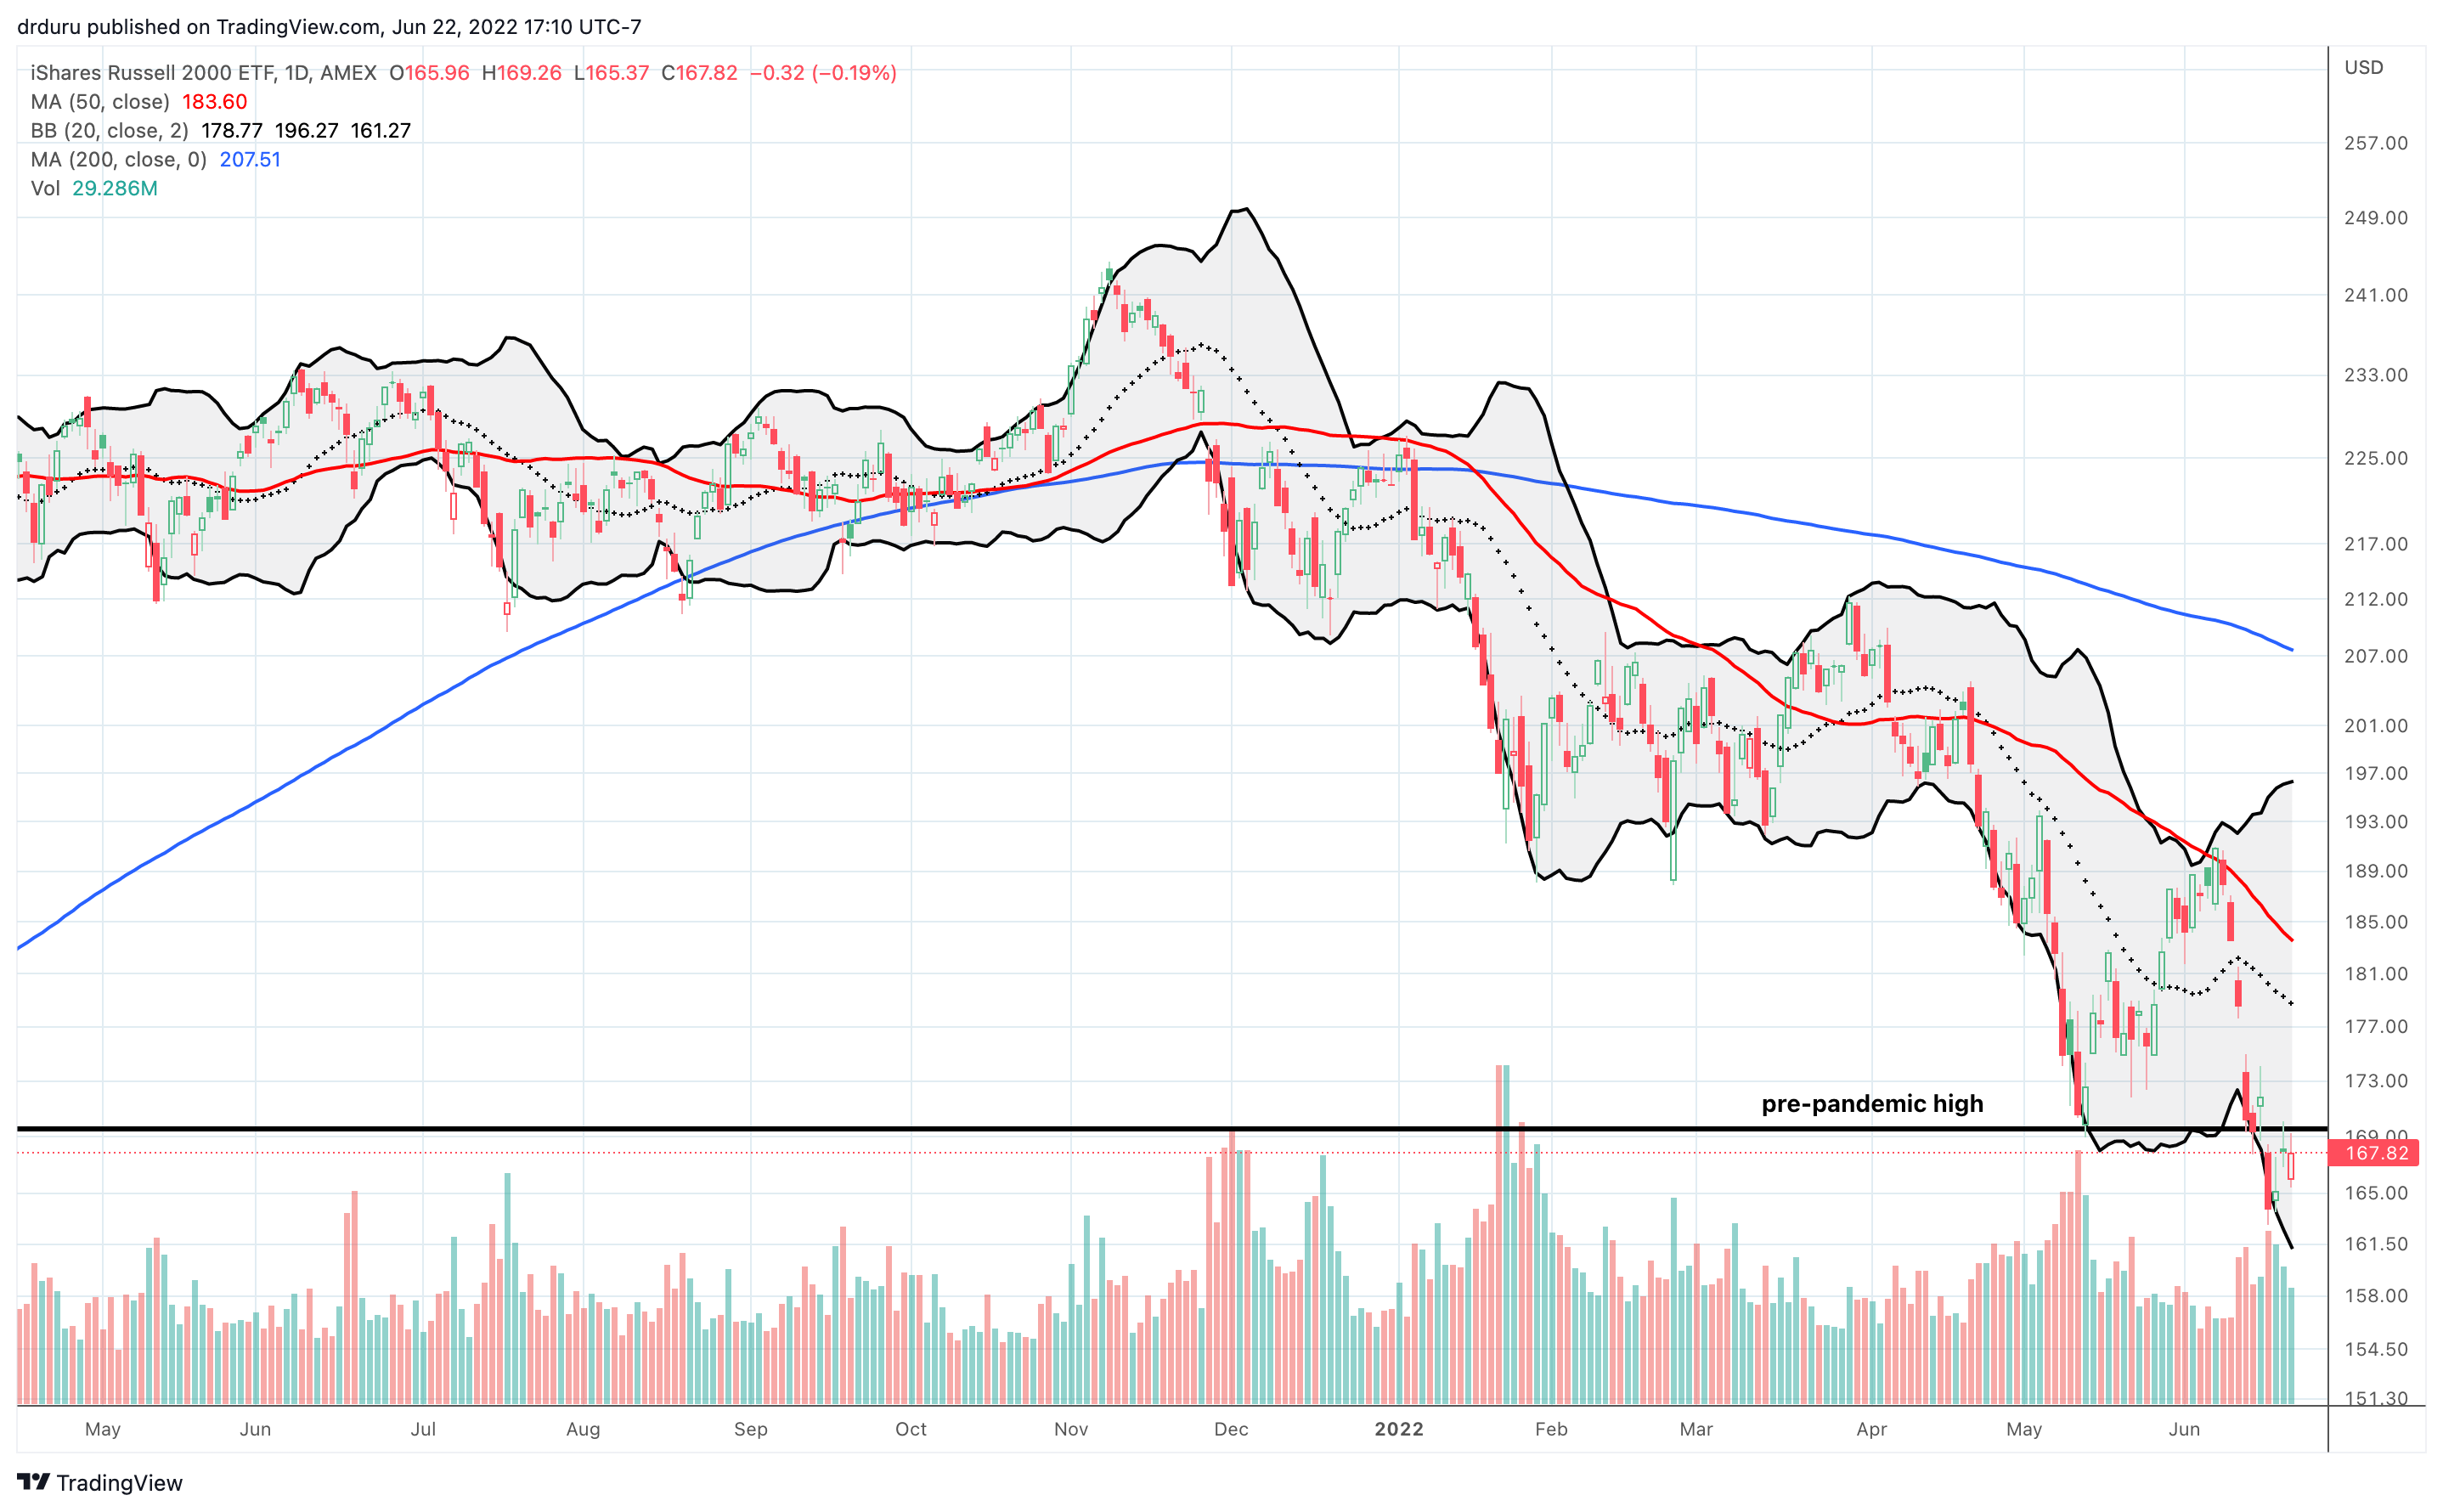
The iShares Russell 2000 ETF (IWM) joined the S&P 500 and the NASDAQ in failing at key resistance levels in the bear’s shadow. IWM’s pre-pandemic high looms large over the current discontented trading action. IWM closed with a 1.8% gain on Tuesday after failing perfectly at resistance from the pre-pandemic high. Similarly, today’s fresh rally attempt stopped cold at resistance and sent IWM to a 0.2% loss.
Stock Market Volatility
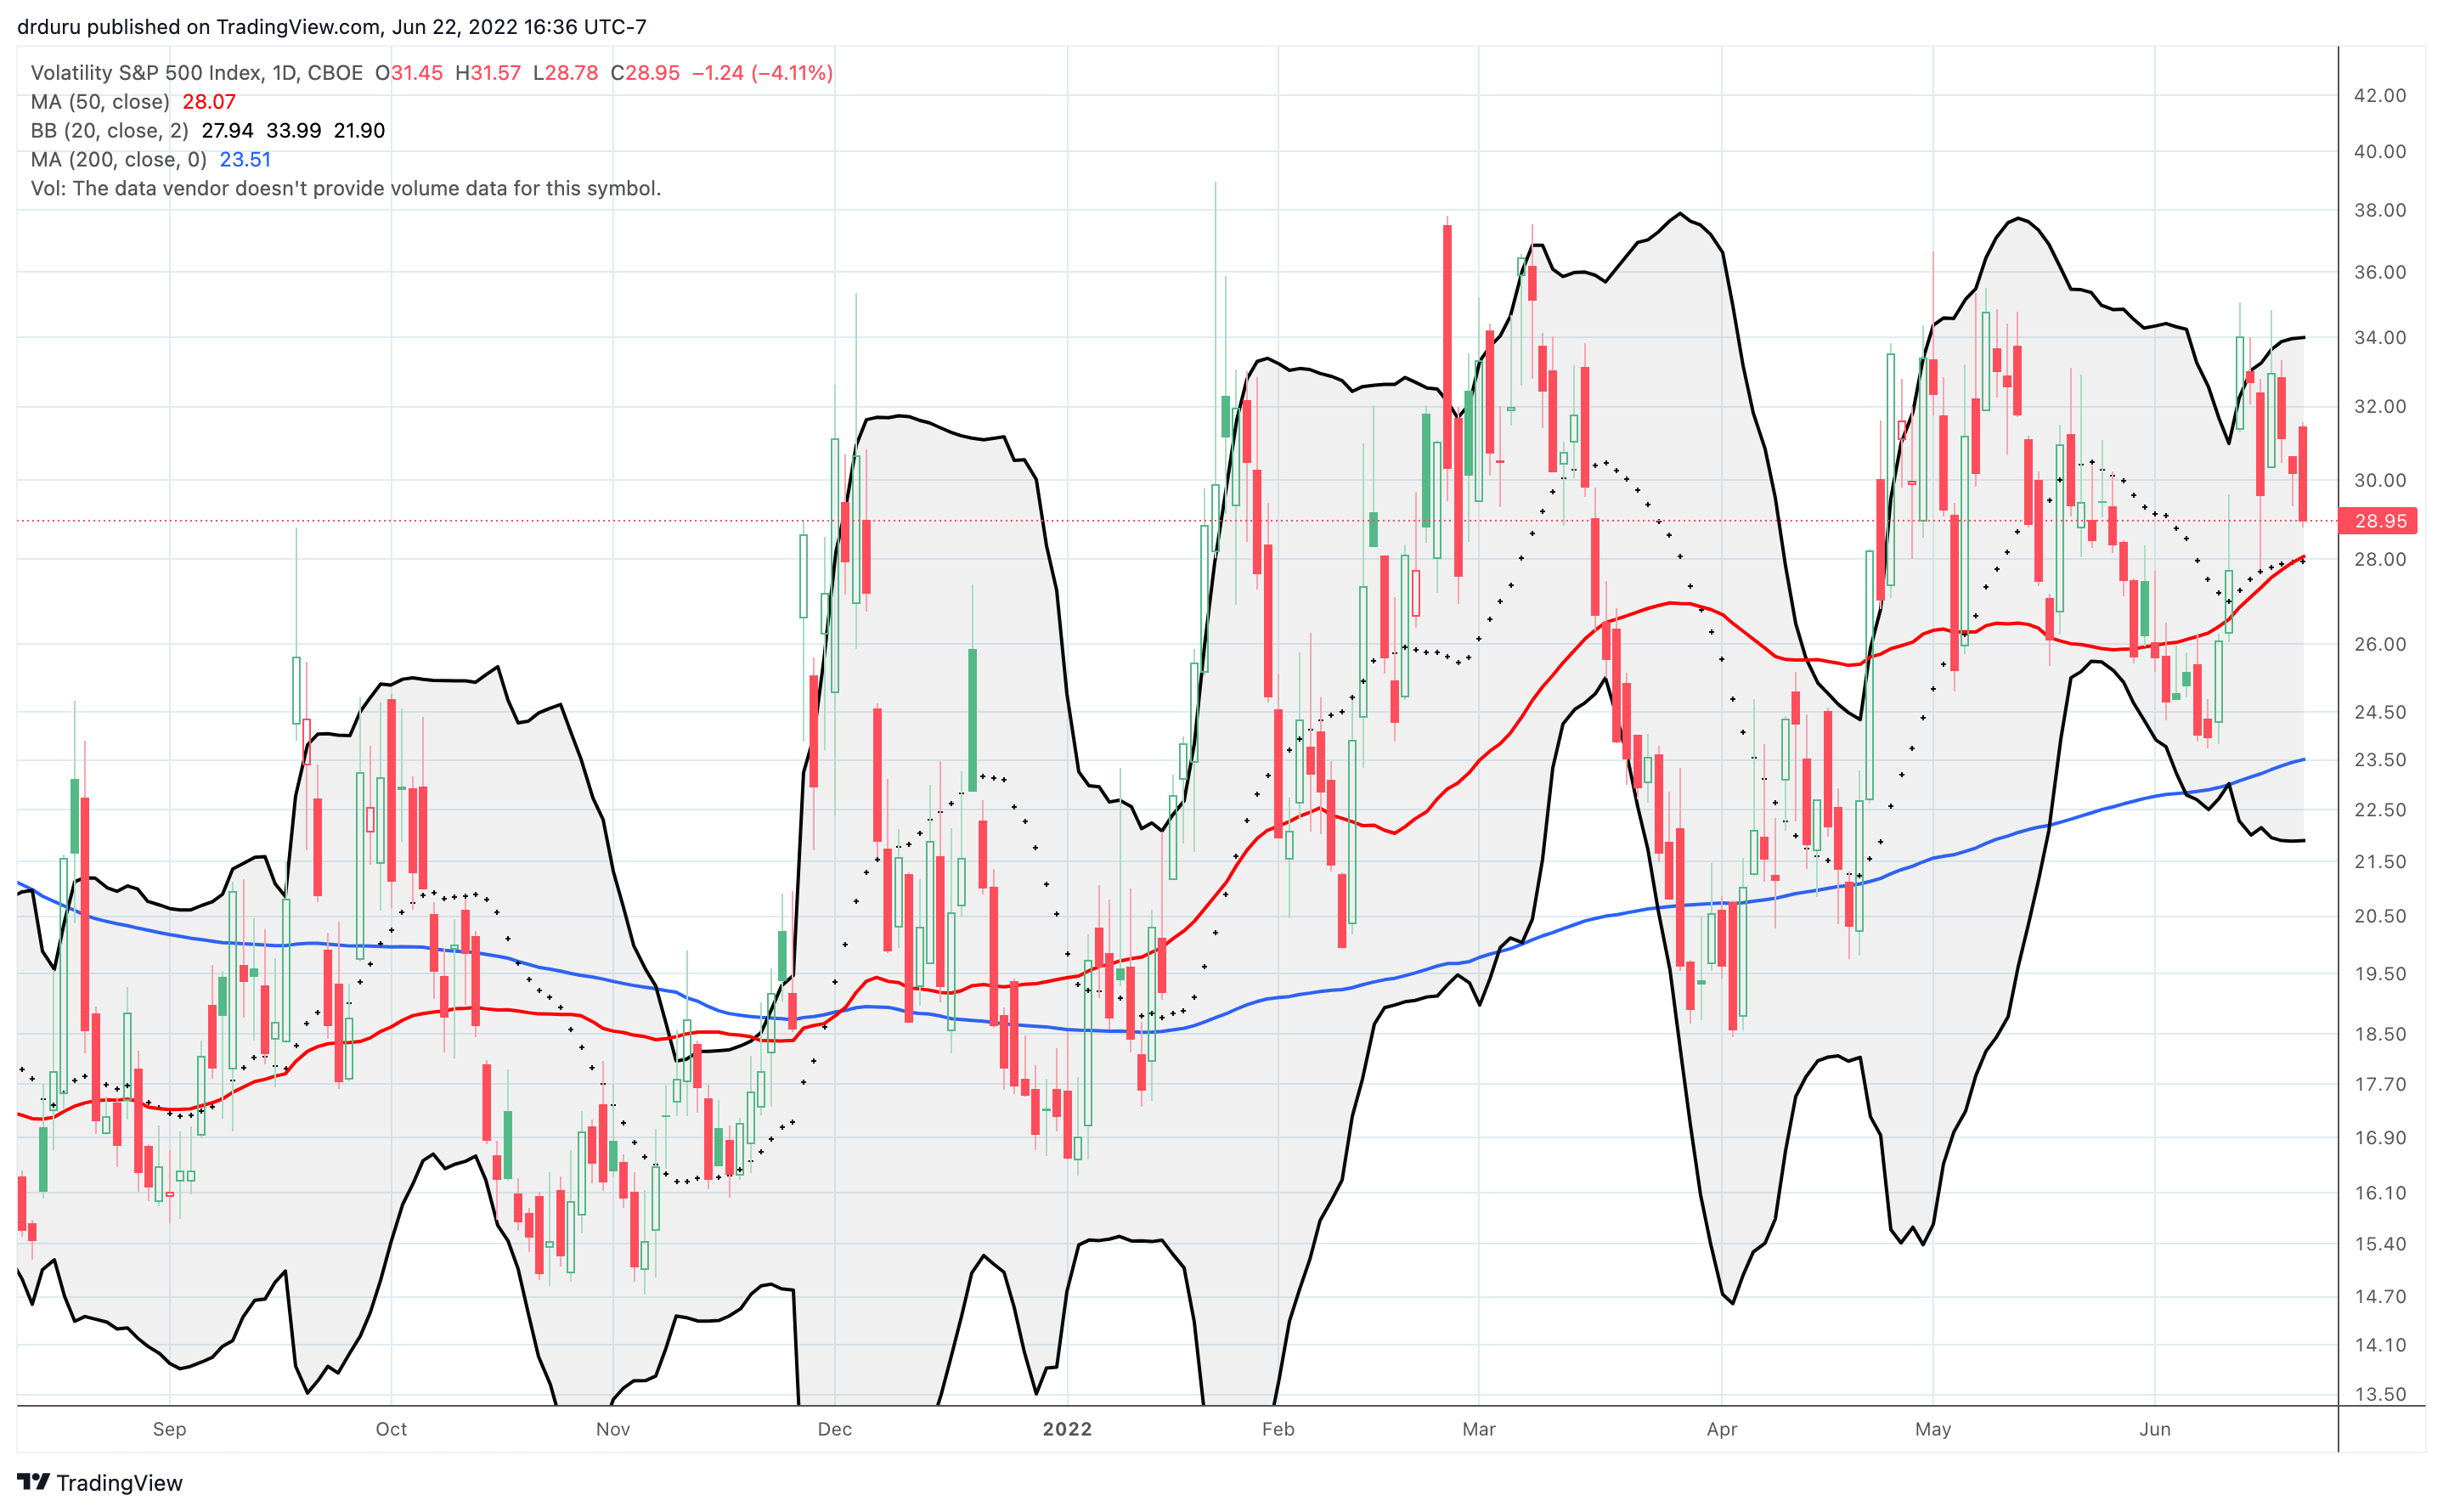
The volatility index (VIX) is doing its own churn. Surprisingly, the VIX has had more down days than up days ever since the last surge on June 13th that marked the VIX’s last top. The VIX has just one up day since then. In other words, the VIX looks, surprisingly enough, like it is losing energy.
The Short-Term Trading Call In A Bear Market‘s Shadow
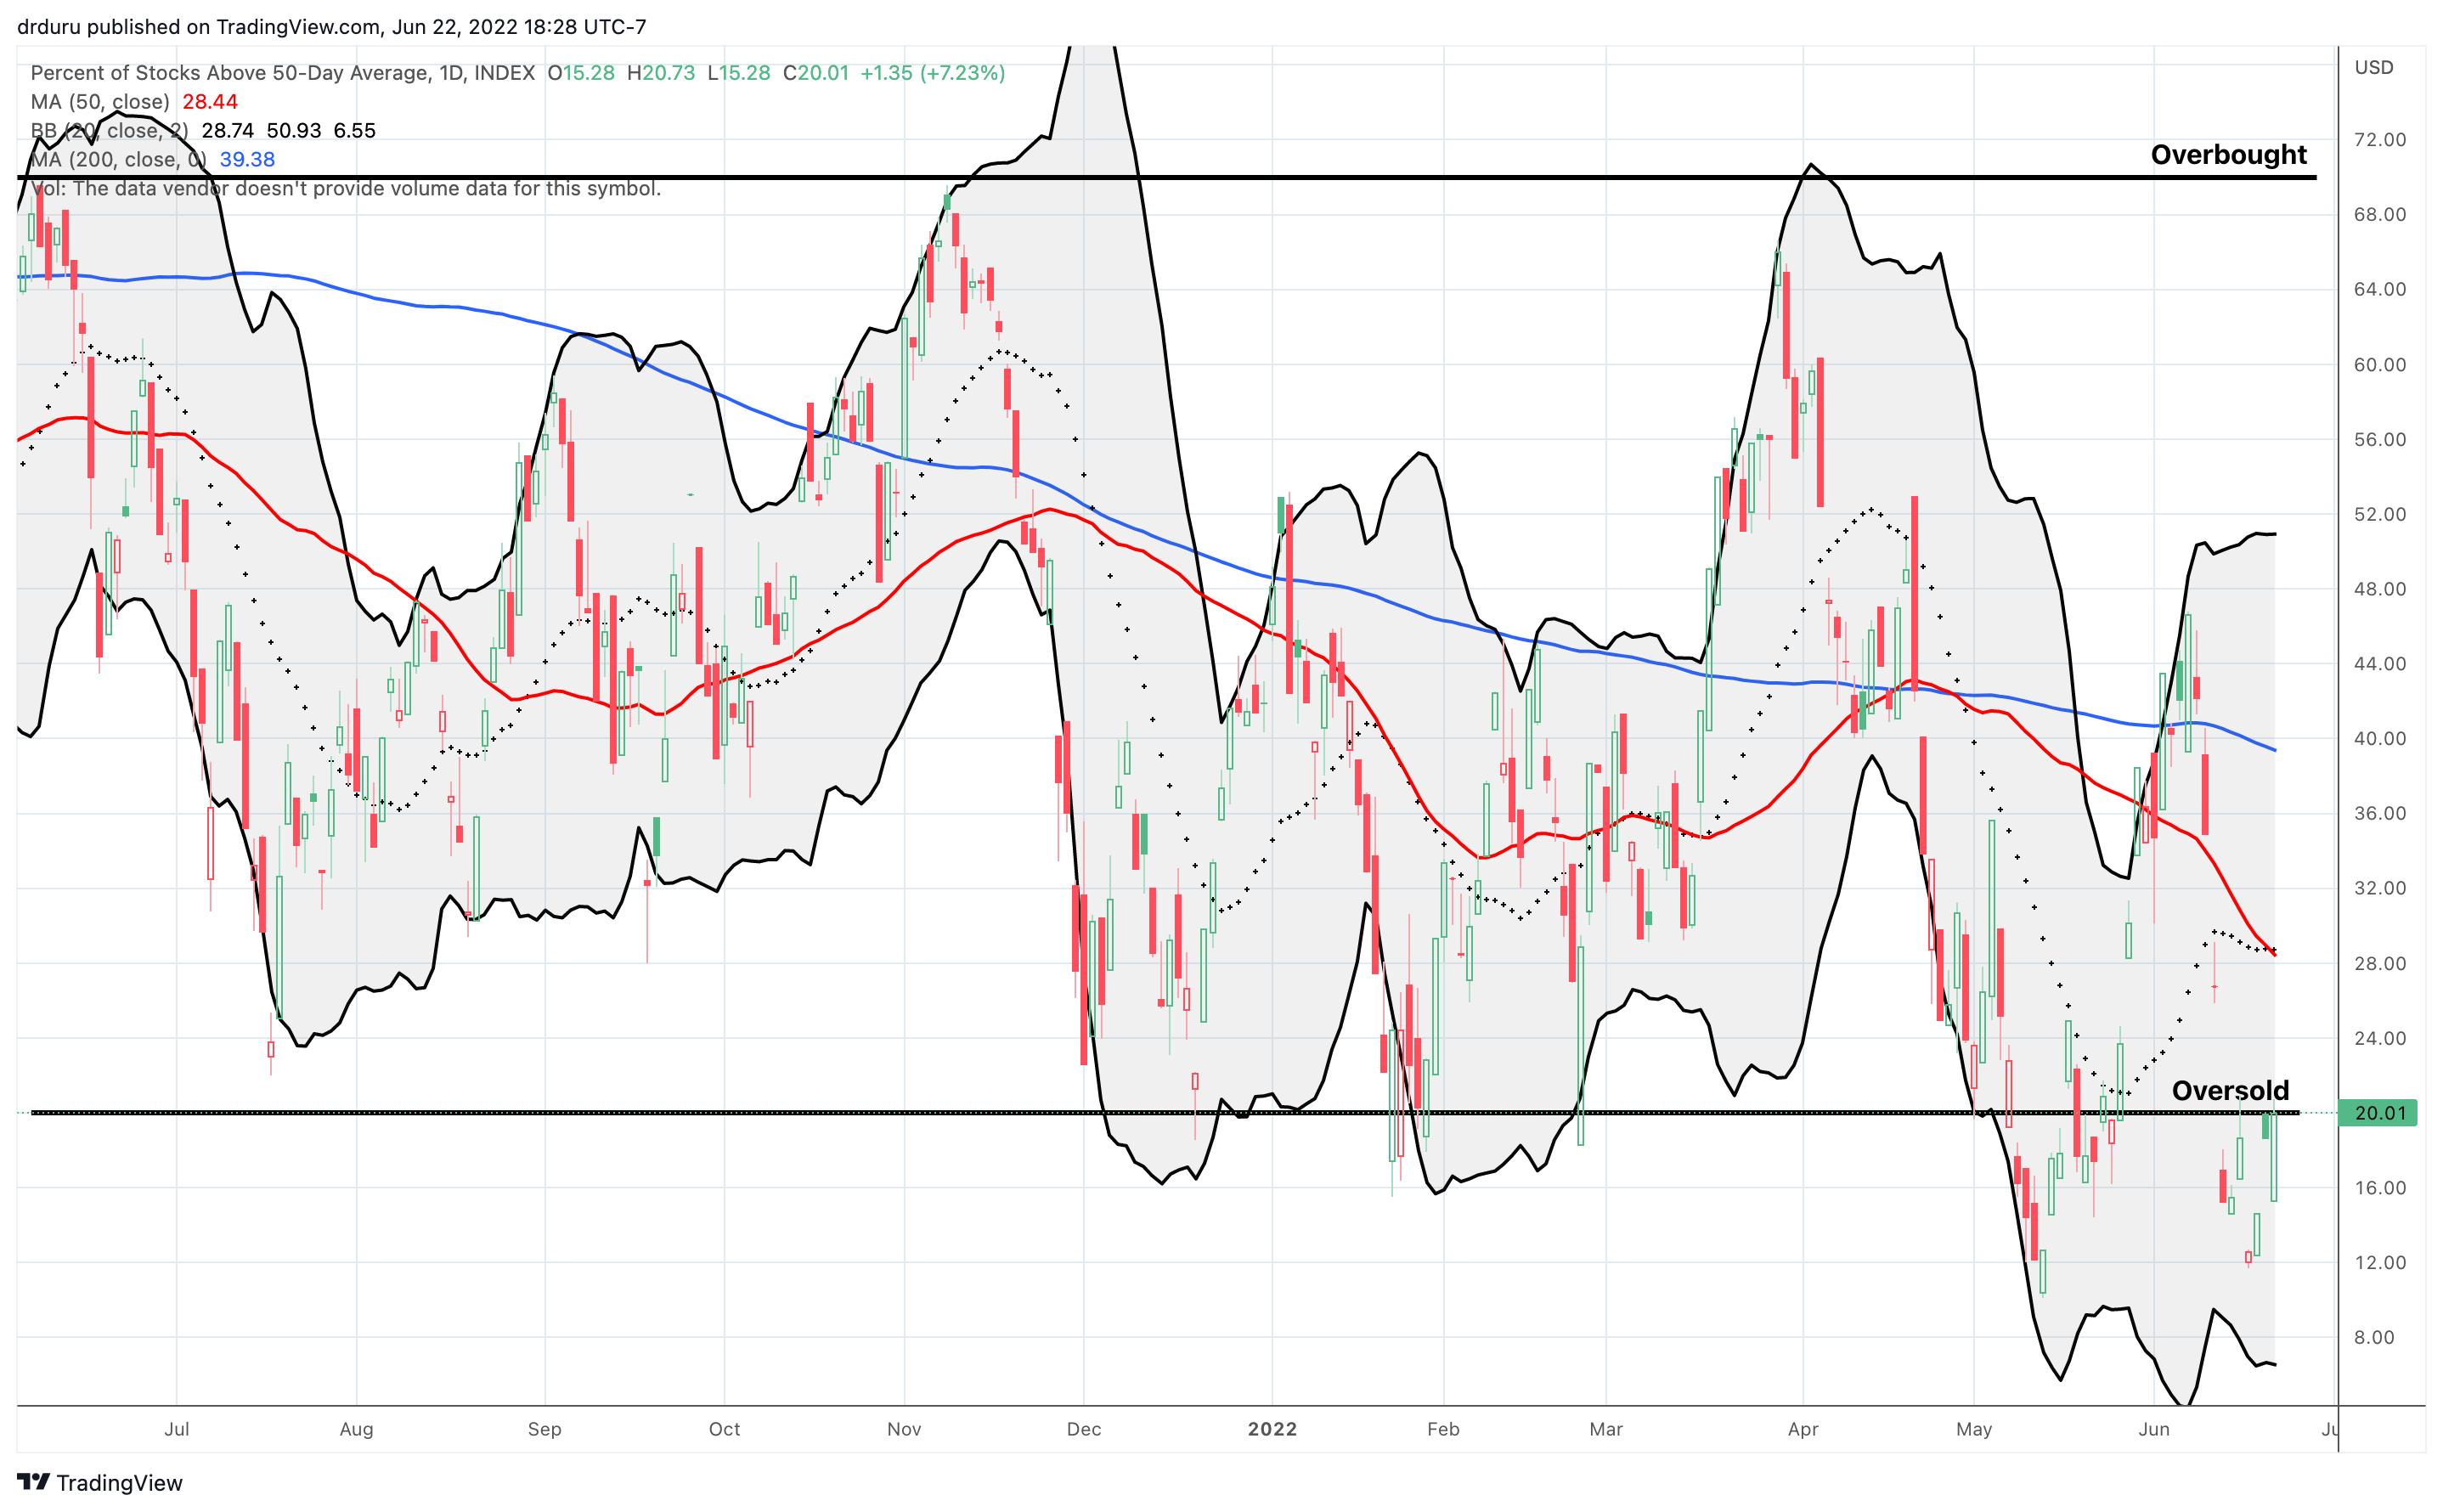
- AT50 (MMFI) = 20.0% of stocks are trading above their respective 50-day moving averages (ending 6 days oversold)
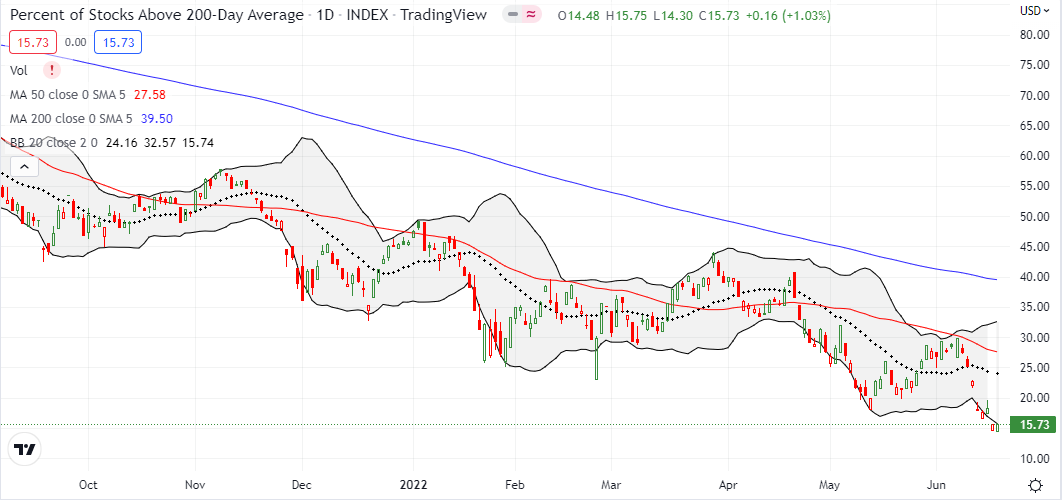
- AT200 (MMTH) = 16.6% of stocks are trading above their respective 200-day moving averages
- Short-term Trading Call: cautiously bullish
AT50 (MMFI), the percentage of stocks trading above their respective 50DMAs, clawed its way out of oversold conditions despite the indices remaining trapped in the bear market’s shadow. I refreshed my browser twice because today’s 20.0% close completely surprised me. Assuming this value is correct, the stock market experienced a minor bullish divergence. A follow-through day should generate a powerful push beyond current resistance levels and set up a run for higher resistance levels like the declining 50DMAs for the S&P 500, NASDAQ, and IWM. Accordingly, I will refresh bullish trades on a push above the closest resistance levels…but I need to see it to believe it.
Be careful out there!
Footnotes
“Above the 50” (AT50) uses the percentage of stocks trading above their respective 50-day moving averages (DMAs) to measure breadth in the stock market. Breadth defines the distribution of participation in a rally or sell-off. As a result, AT50 identifies extremes in market sentiment that are likely to reverse. Above the 50 is my alternative name for “MMFI” which is a symbol TradingView.com and other chart vendors use for this breadth indicator. Learn more about AT50 on my Market Breadth Resource Page. AT200, or MMTH, measures the percentage of stocks trading above their respective 200DMAs.
Active AT50 (MMFI) periods: Day #1 over 20% (overperiod ending 6 days oversold), Day #8 under 30% (underperiod), Day #10 under 40%, Day #54 under 50%, Day #59 under 60%, Day #330 under 70%
Source for charts unless otherwise noted: TradingView.com
Full disclosure: long QQQ put spread; long SPY call spread
FOLLOW Dr. Duru’s commentary on financial markets via StockTwits, Twitter, and even Instagram!
*Charting notes: Stock prices are not adjusted for dividends. Candlestick charts use hollow bodies: open candles indicate a close higher than the open, filled candles indicate an open higher than the close.

