Stock Market Commentary
Traders switched up sentiment in the stock market with a flash. After struggling under the shadow of the bear for nearly two weeks, buyers made a bullish dash for stocks. The major indices flipped from key fades at critical resistance to convincing slices through key resistance. The broad based buying put a clear end to oversold trading conditions and left behind bottoming patterns formed by resistance turned support. The major indices printed their own, yet synchronized, turnarounds that put their downtrends in sight for a challenge.
The Stock Market Indices
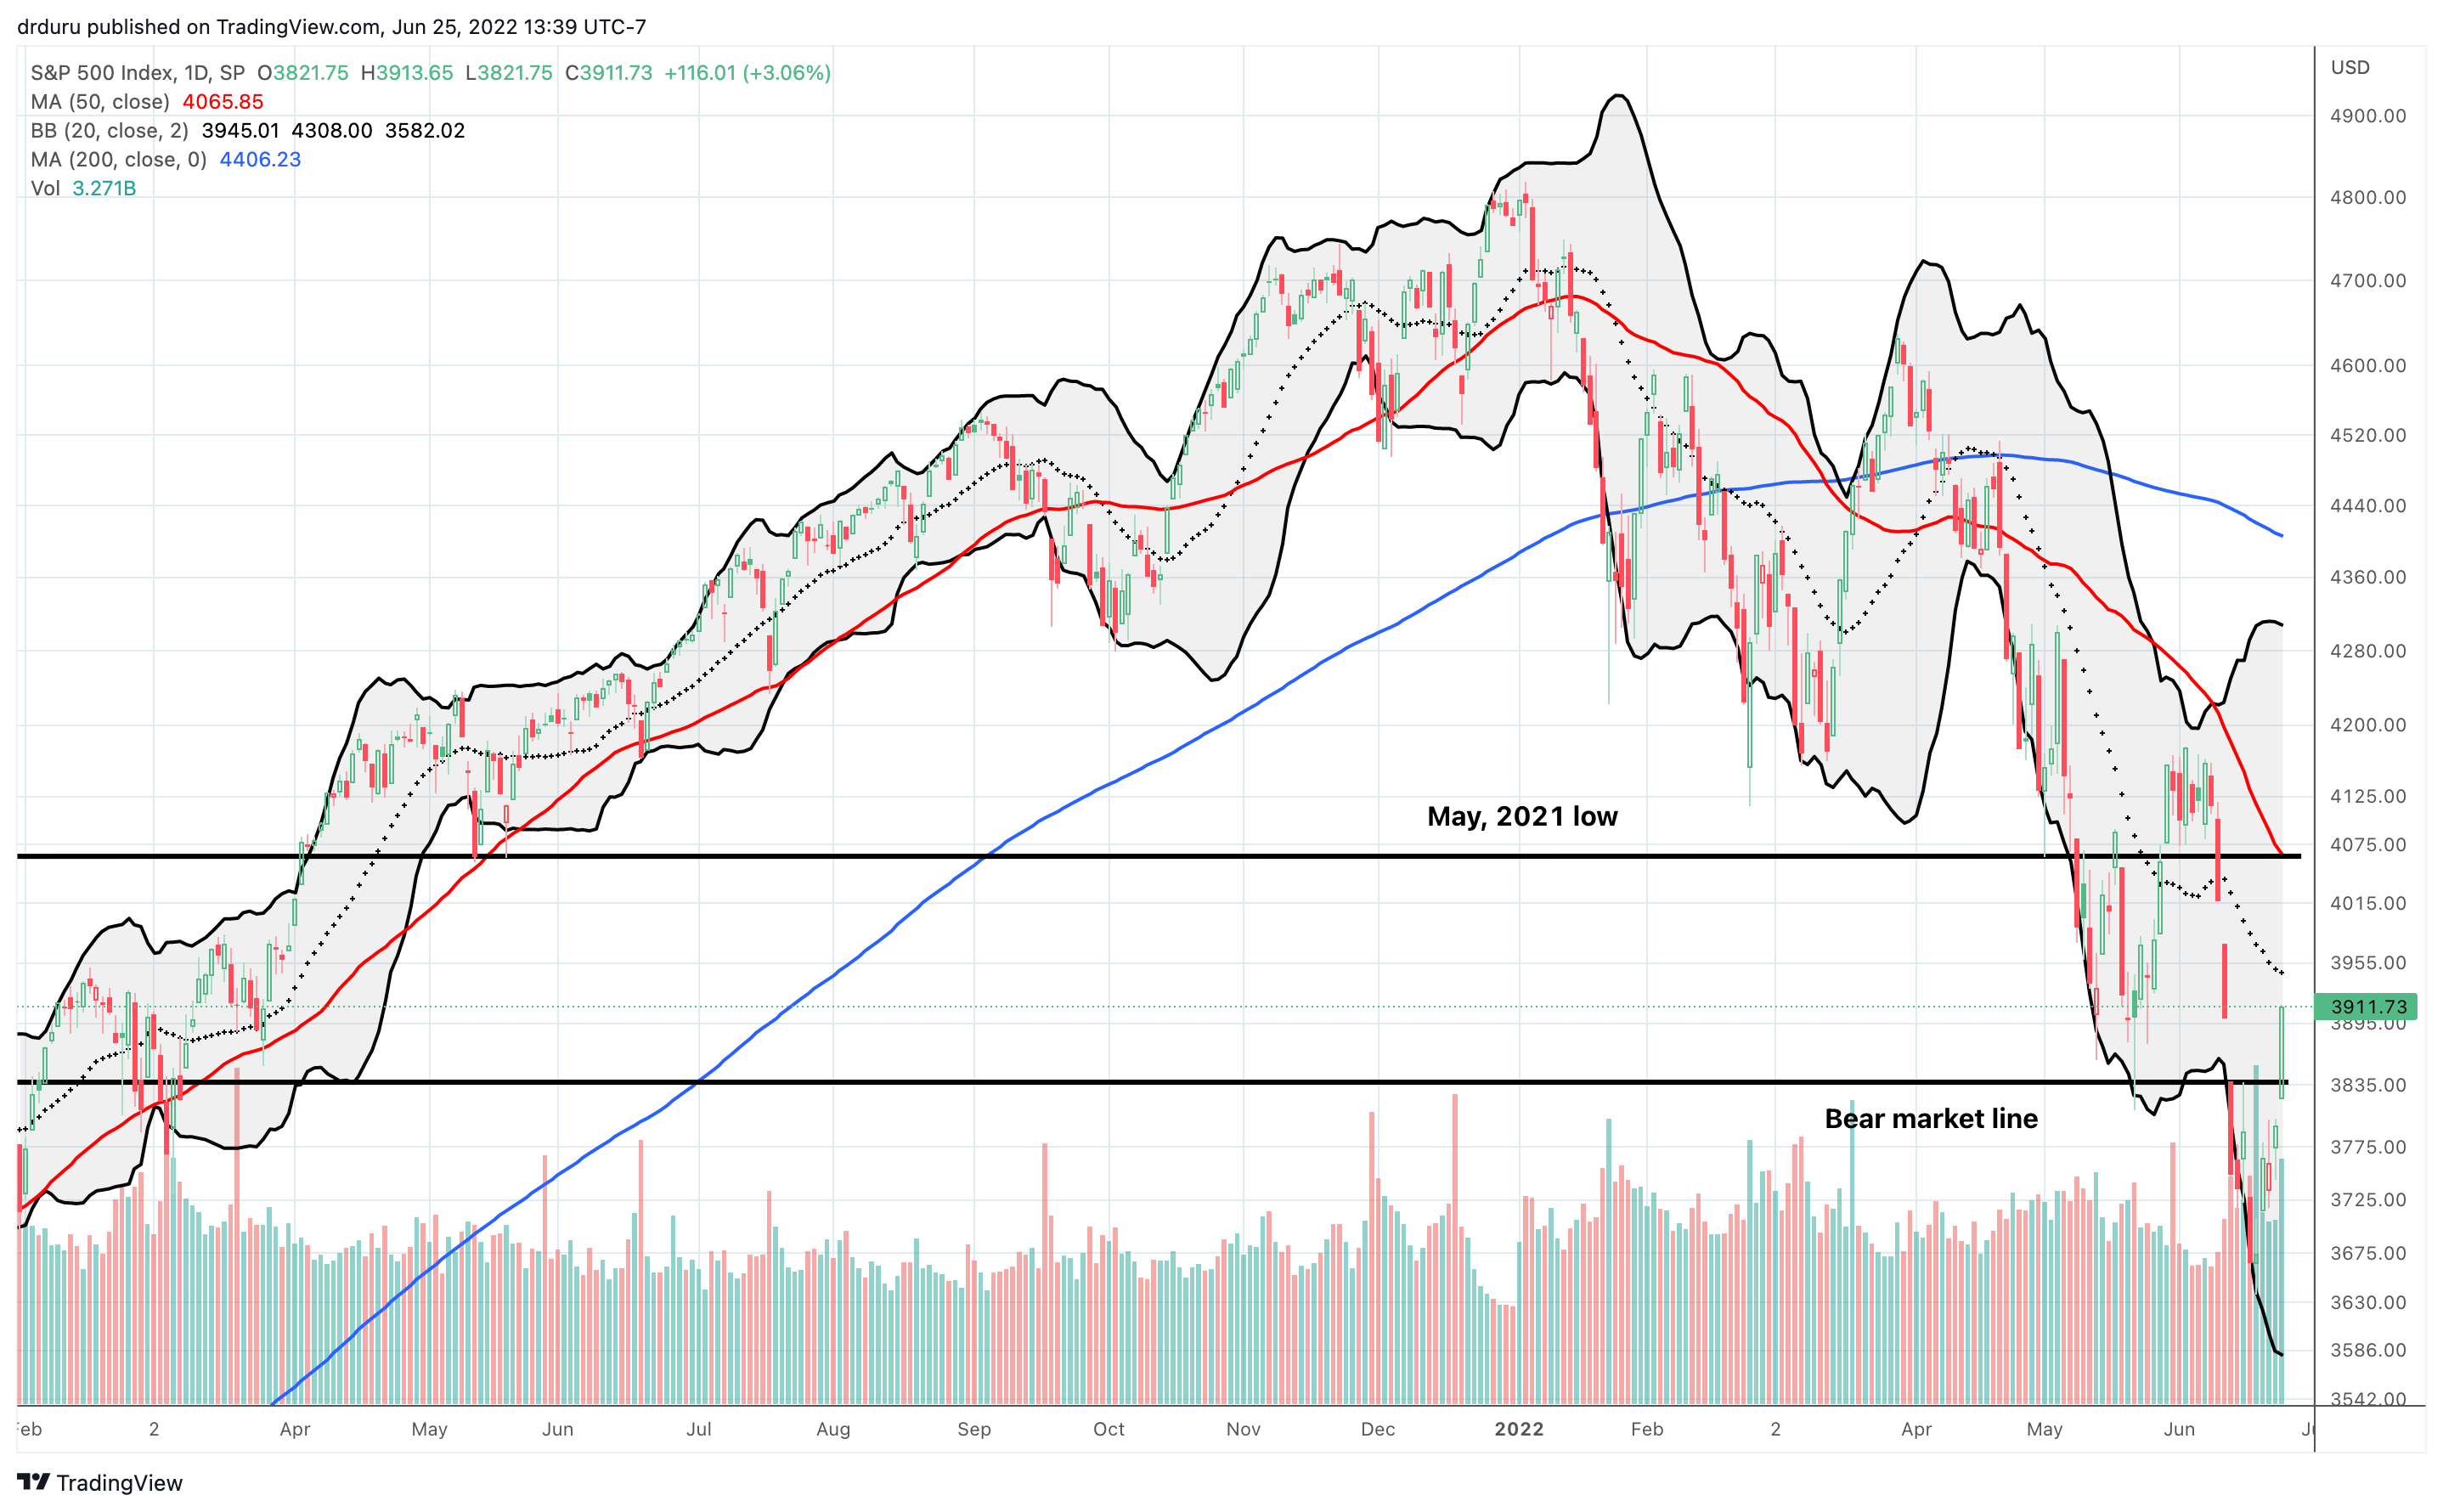
The S&P 500 (SPY) finally blew past its bear market line. Friday’s 3.1% surge sent the index close to its declining 20-day moving average (DMA) (the dotted line below). As I outlined this potential scenario in the last Market Breadth post, this breakout sets up the S&P 500 for a challenge of overhead resistance at its 50DMA (the red line). Moreover, the index is buyable on dips as long as it remains above the bear market line. Risk/reward depends on the proximity of important overhead resistance.
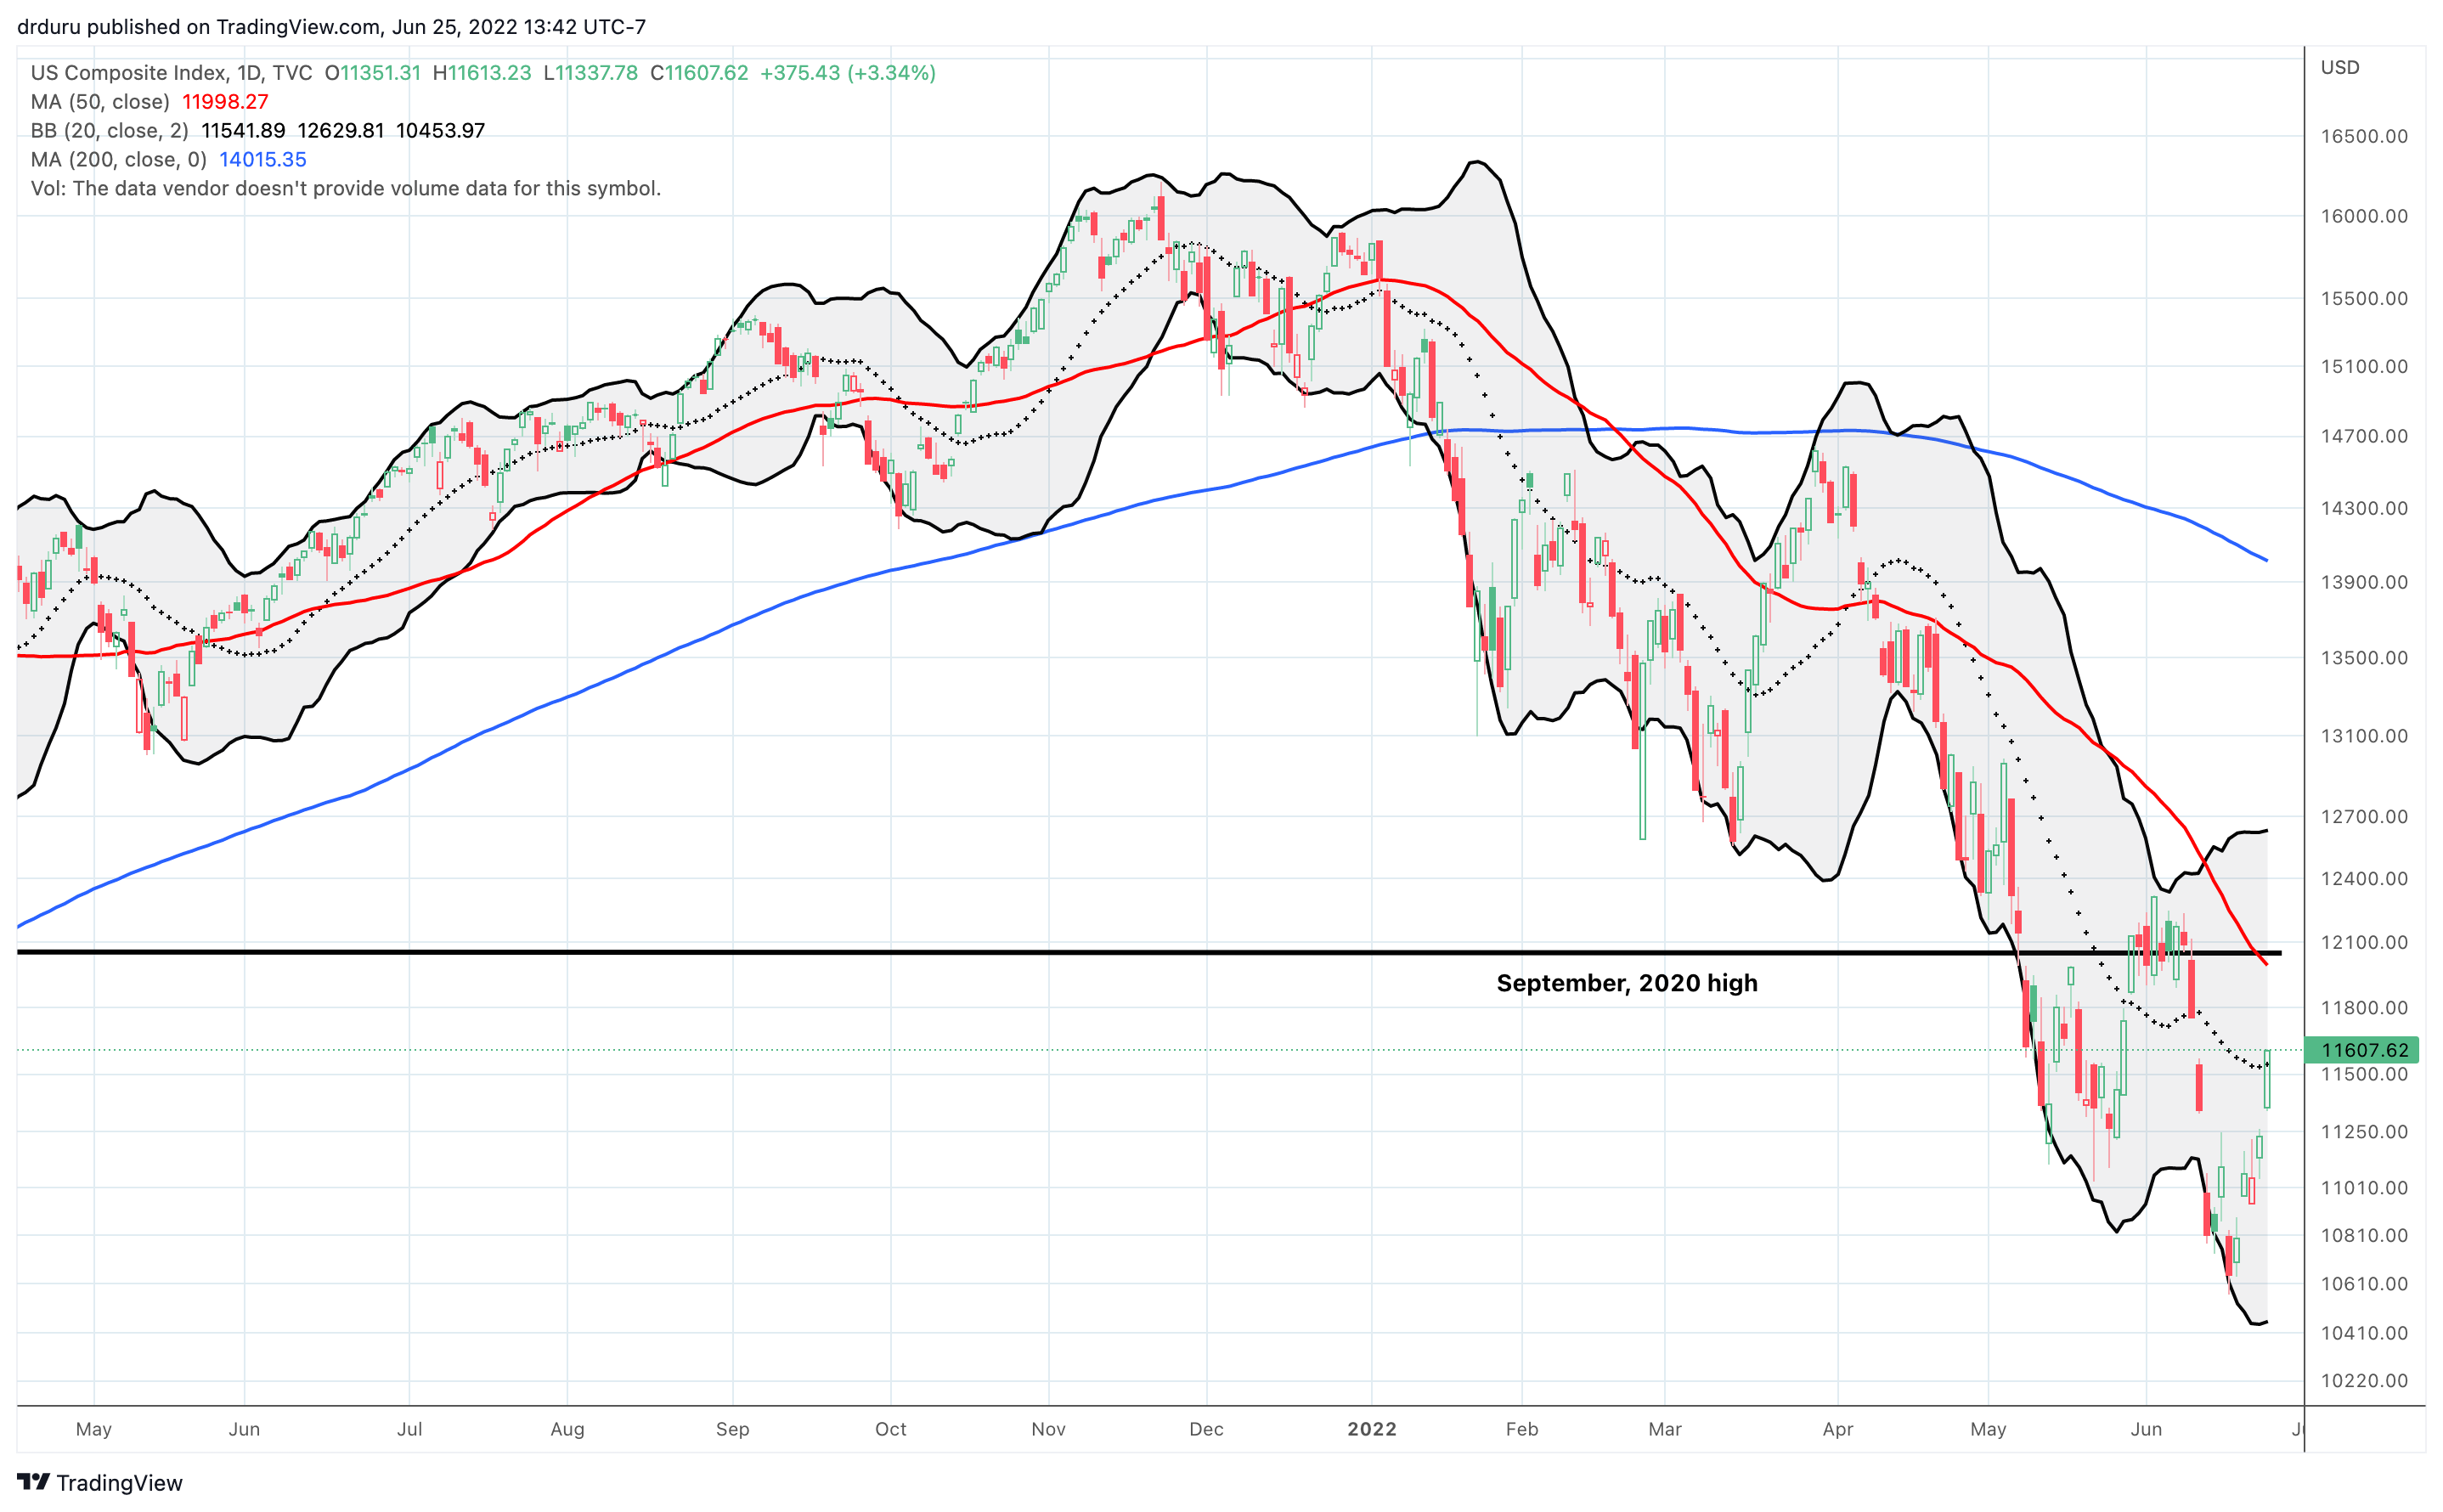
The NASDAQ (COMPQ) did the S&P 500 one better by using its 3.3% surge to close above its downtrending 20DMA resistance. The tech-laden index is now in position for an important test of downtrending 50DMA resistance which has also converged with the September, 2020 high. However, the NASDAQ will not “clear” danger until it hurdles the June high
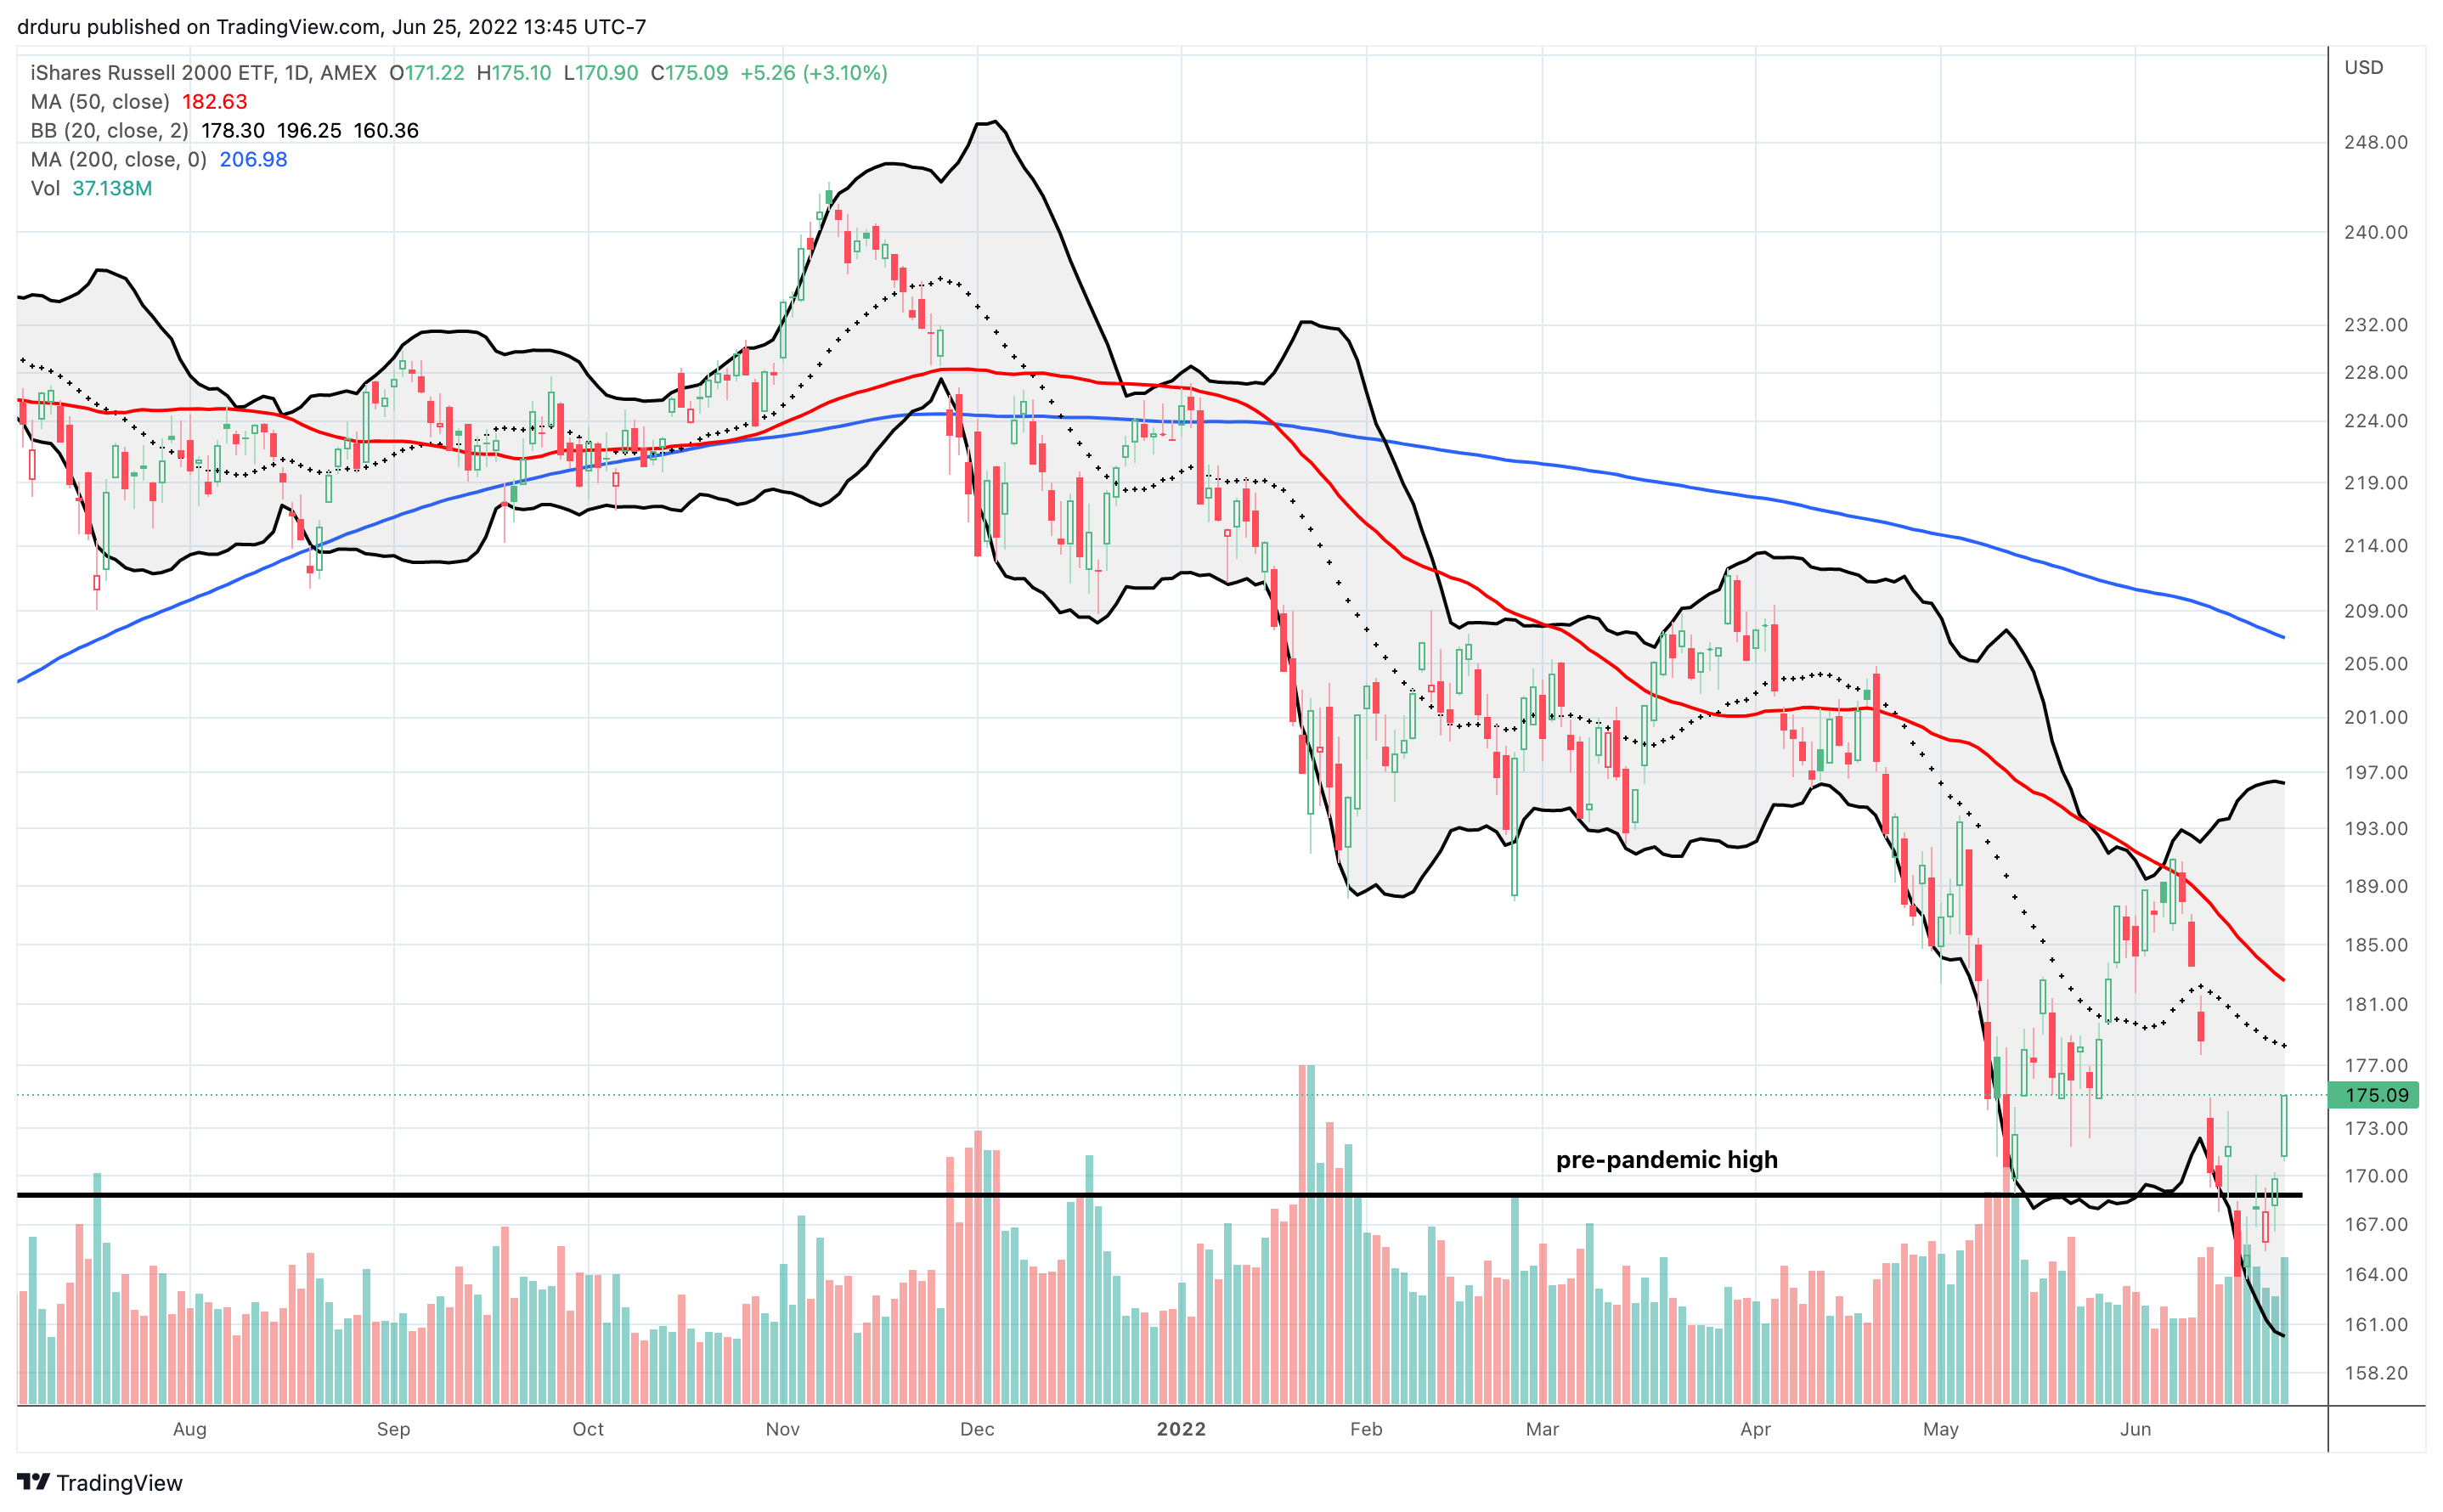
The iShares Russell 2000 ETF (IWM) gained 3.1% and still has a notable gap to close with its declining 20DMA. The rapidly converging 50DMA is close enough to render the 20DMA a weaker signal than with the S&P 500 and NASDAQ. IWM looks good for a buy on dips as long as it stays above its pre-pandemic high. Friday’s rally also launched from around that level.
Stock Market Volatility
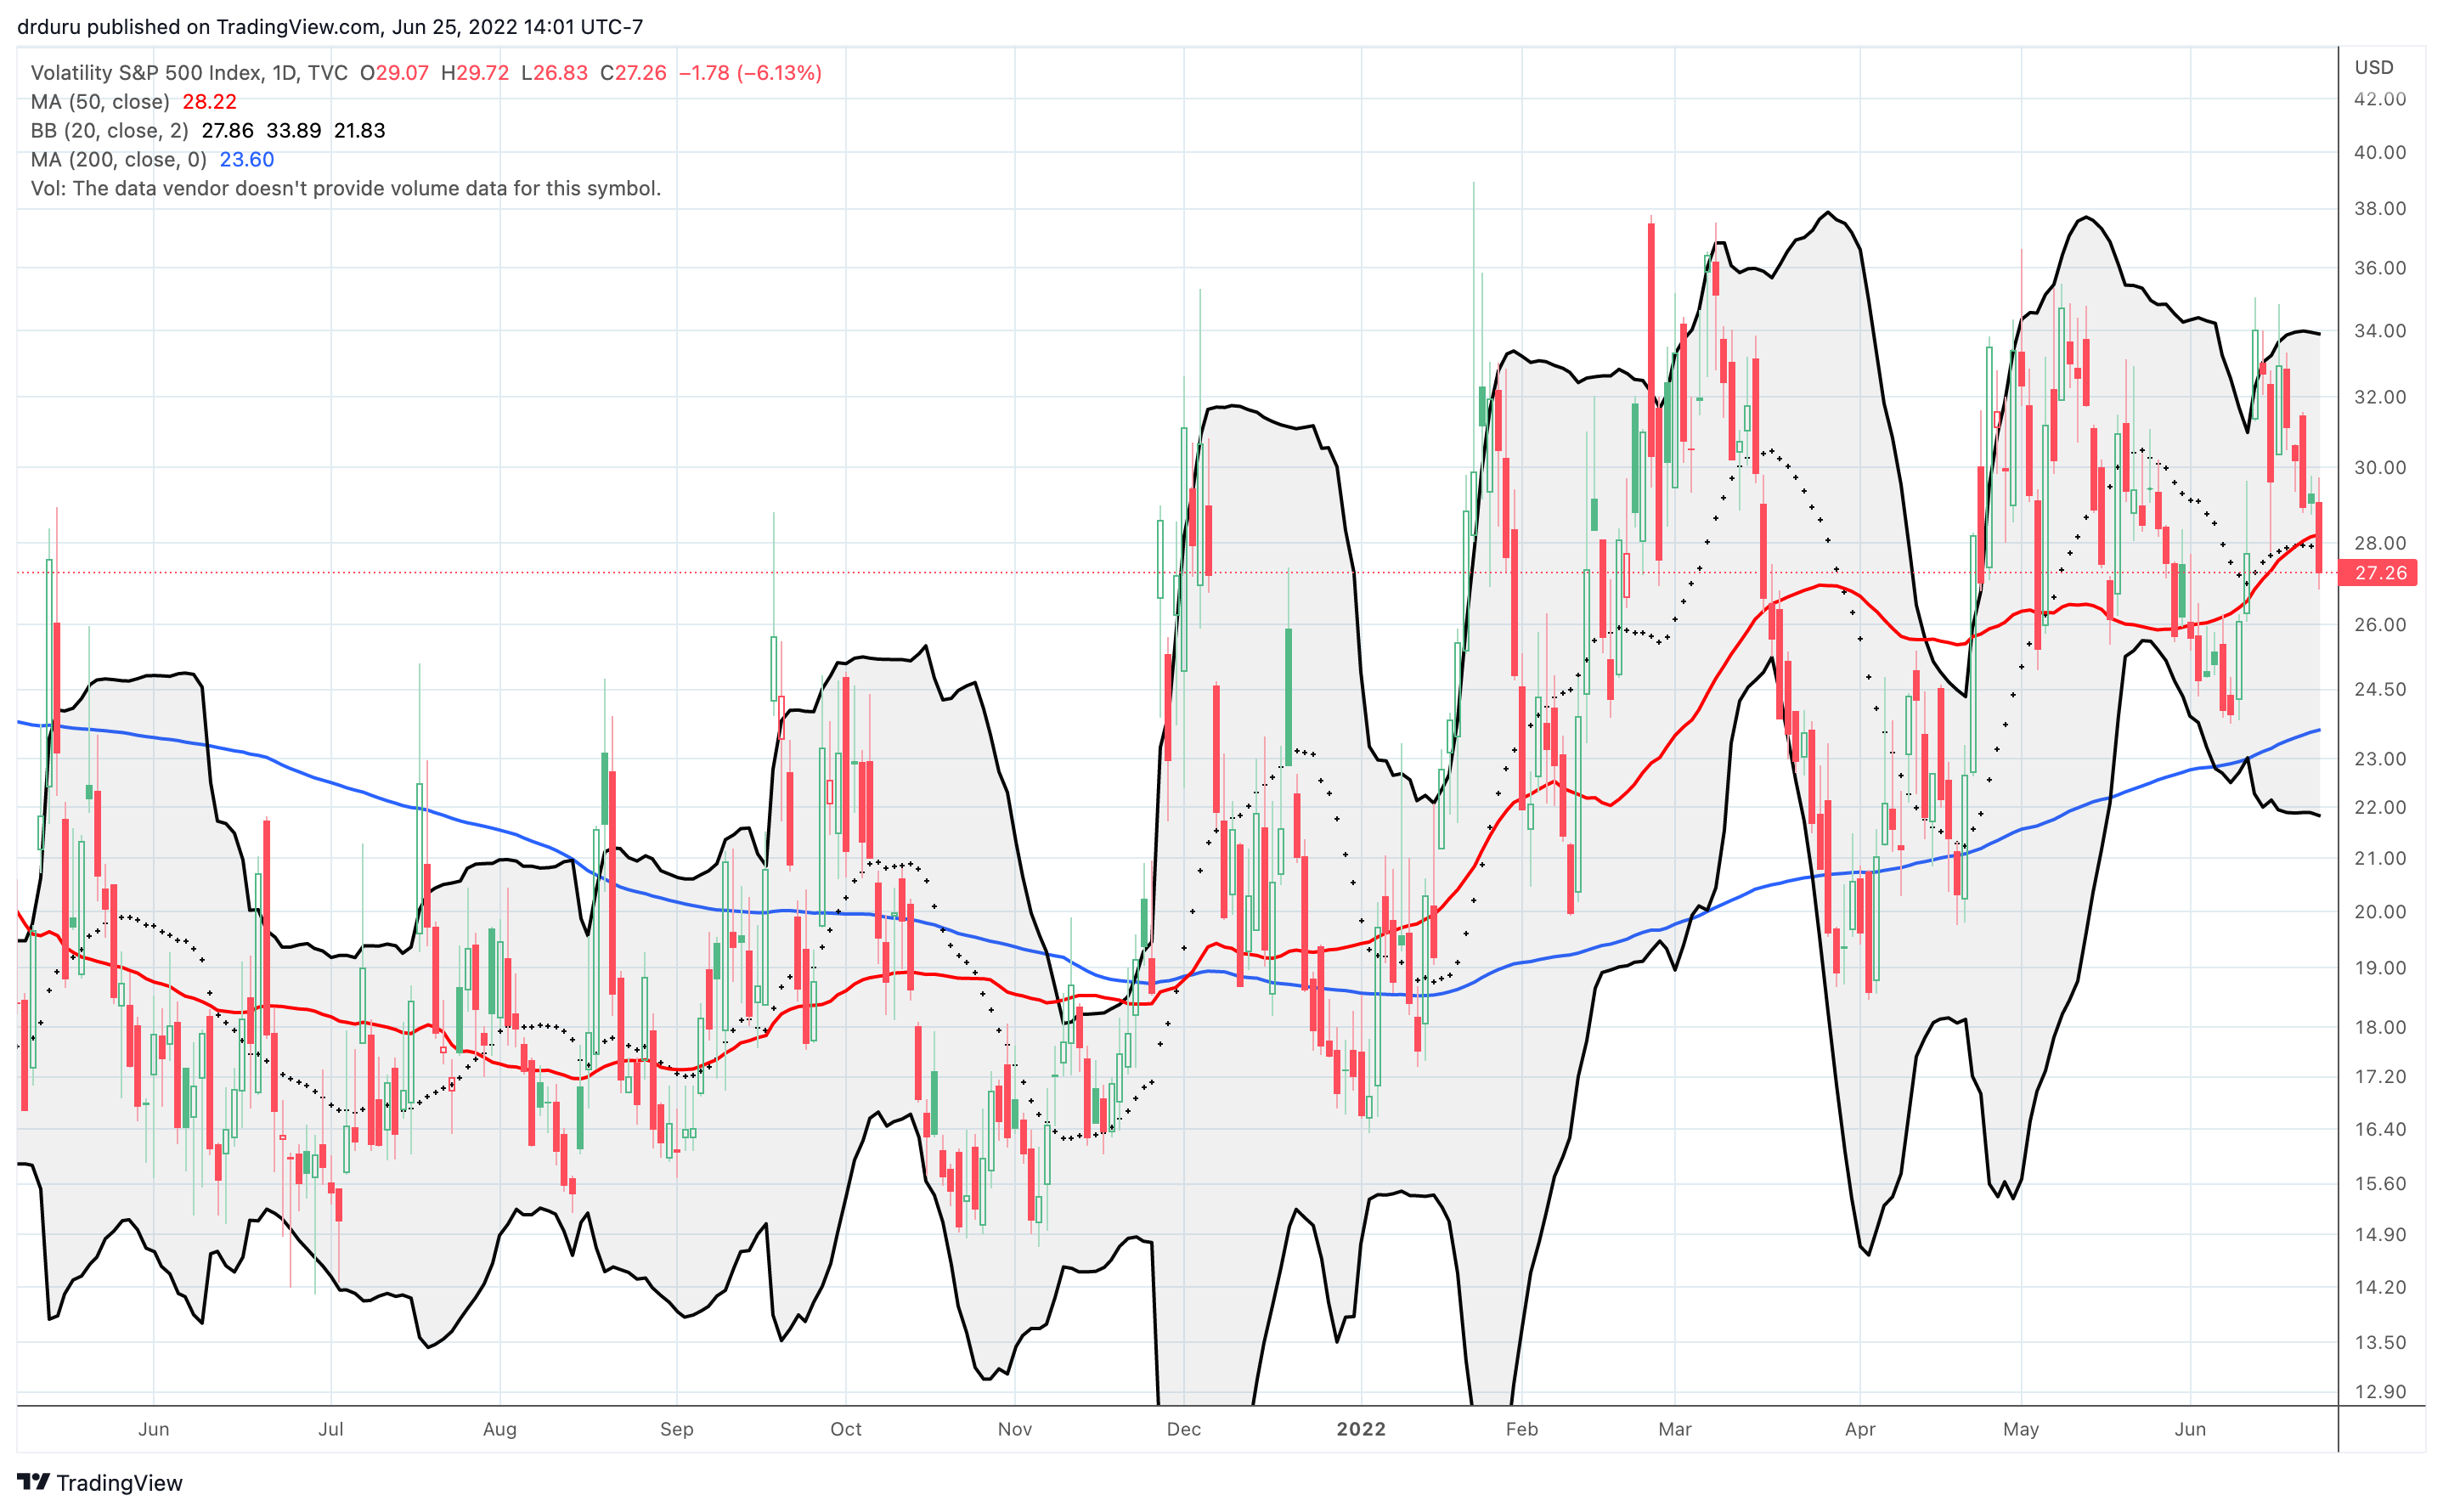
The volatility index (VIX) followed through on its previous weakness. The VIX lost 6.3% for its lowest close in 10 trading days. Volatility faders finally reversed all the gains from the June 13th surge. This move sets up the VIX to test the June low. Most importantly, this fade supports a bullish interpretation of the short-term trading action.
The Short-Term Trading Call With Downtrends In Sight
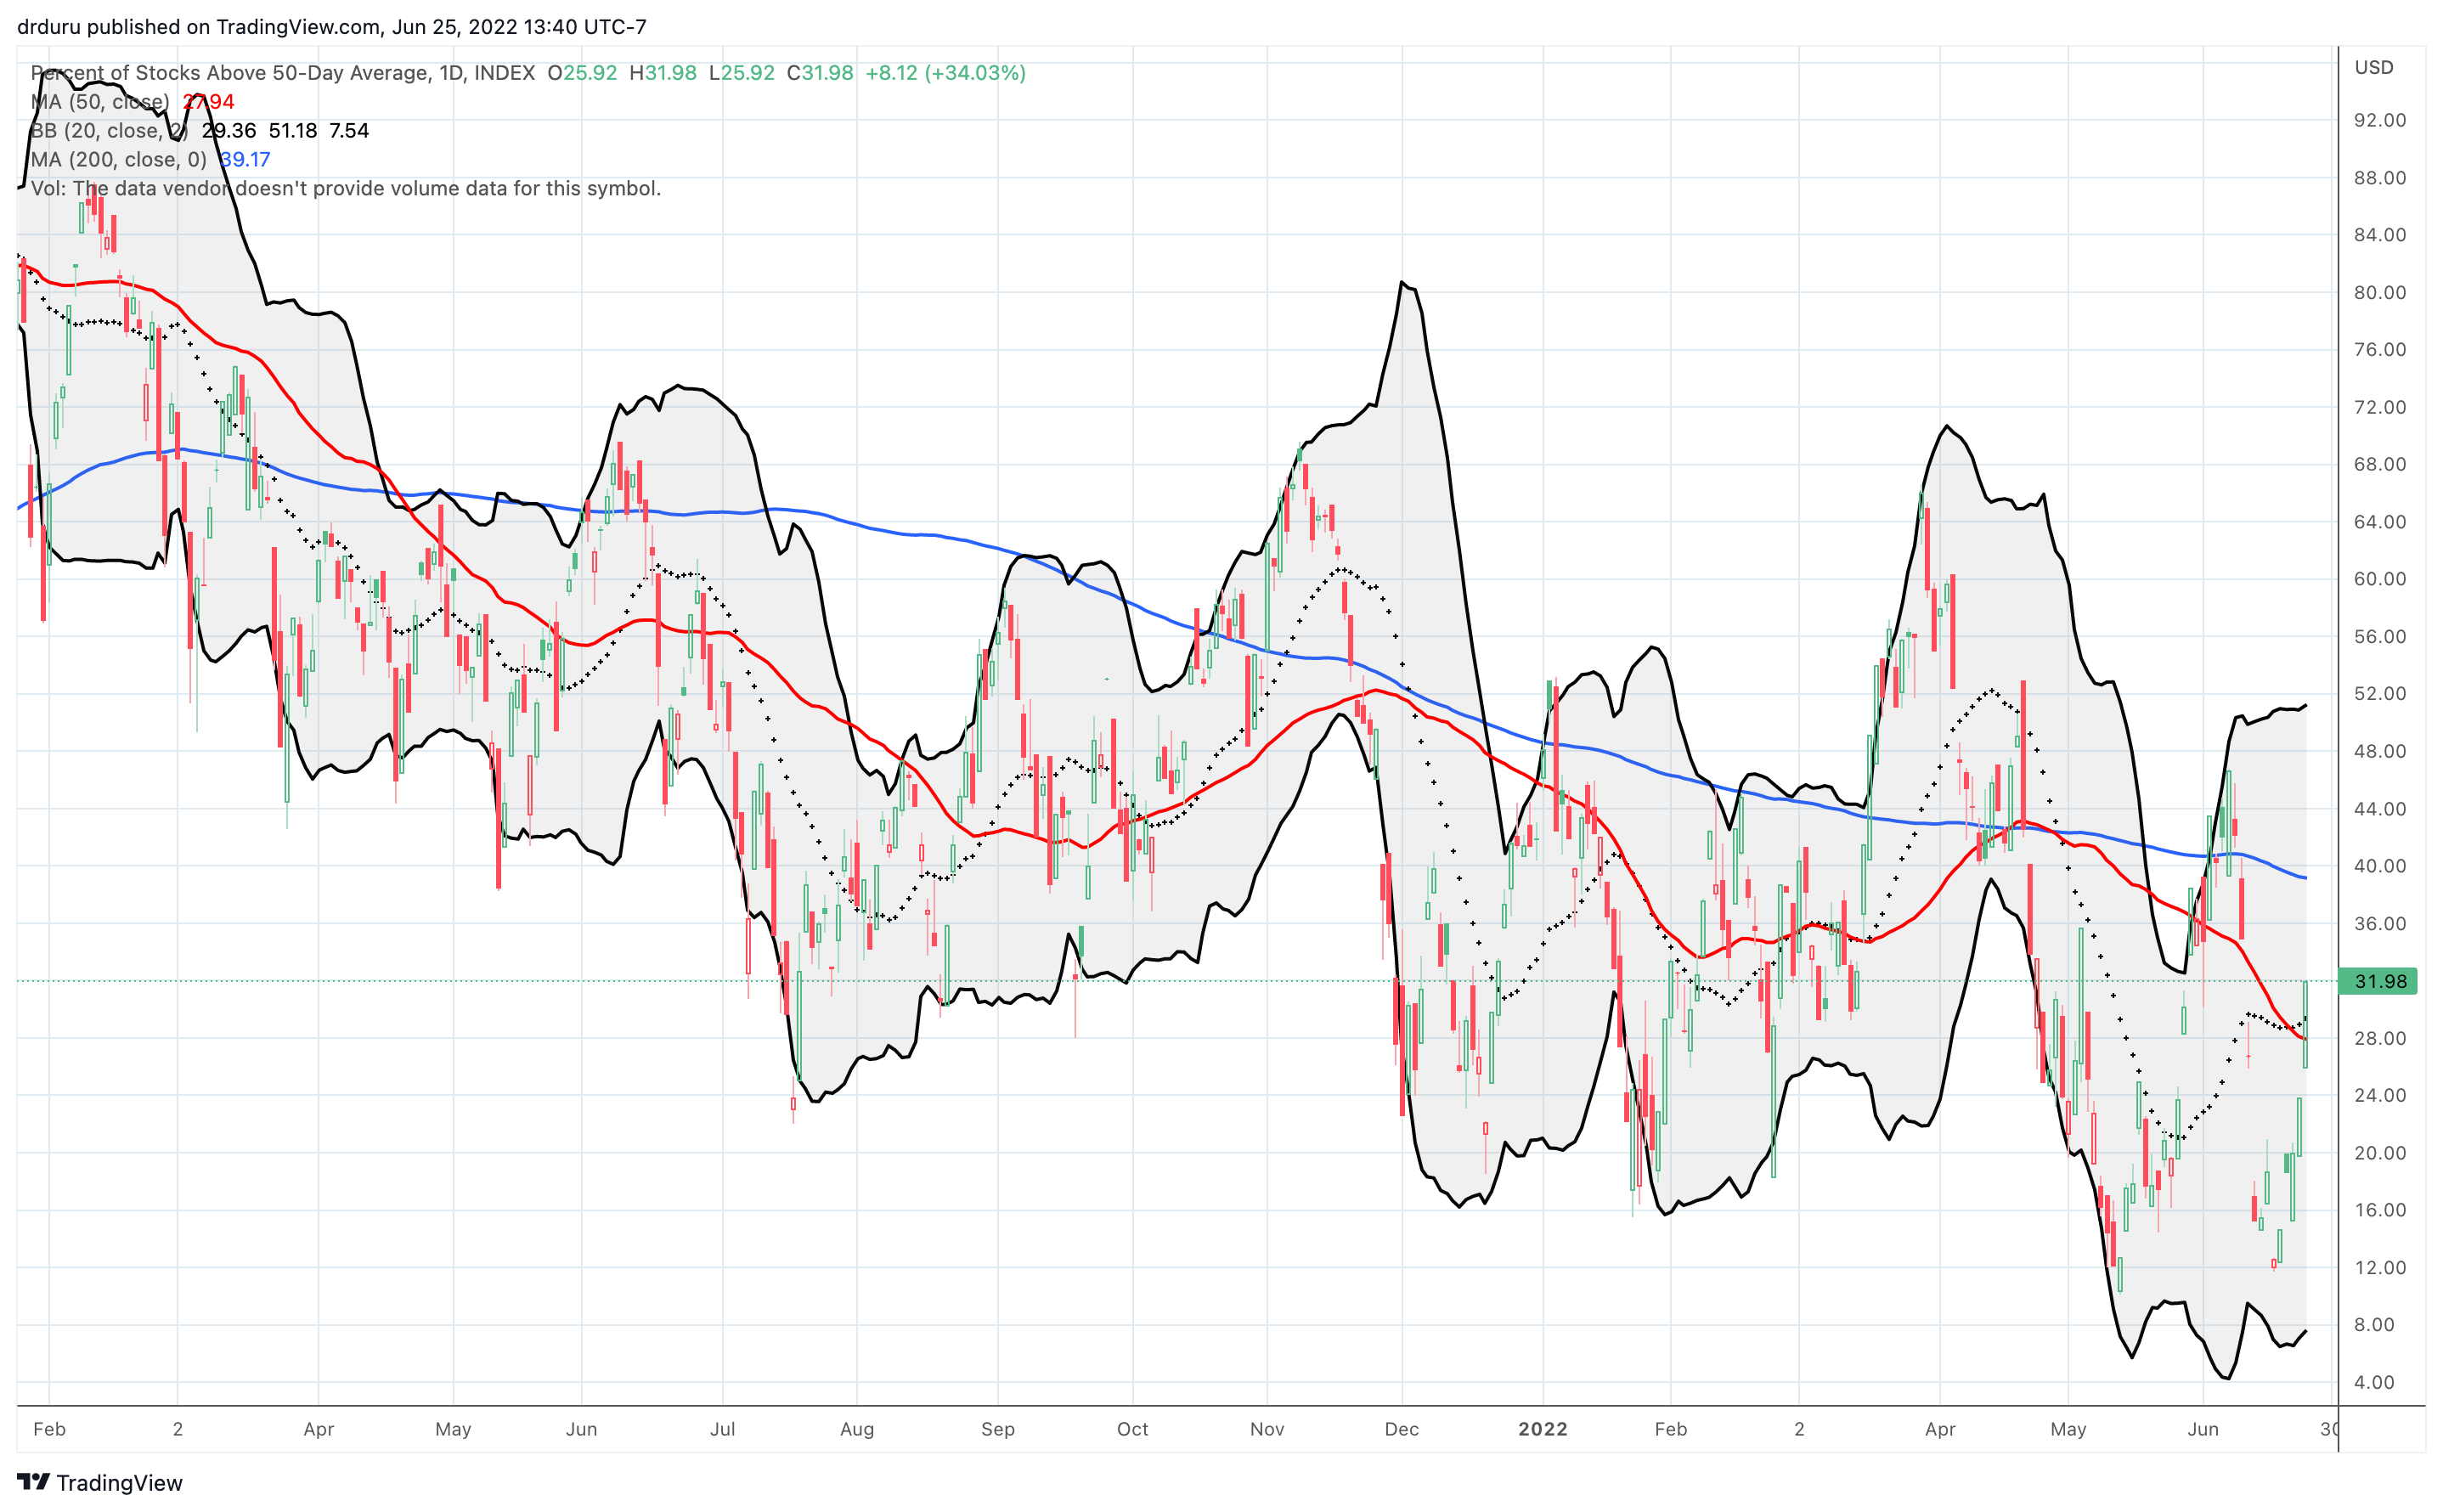
- AT50 (MMFI) = 32.0% of stocks are trading above their respective 50-day moving averages
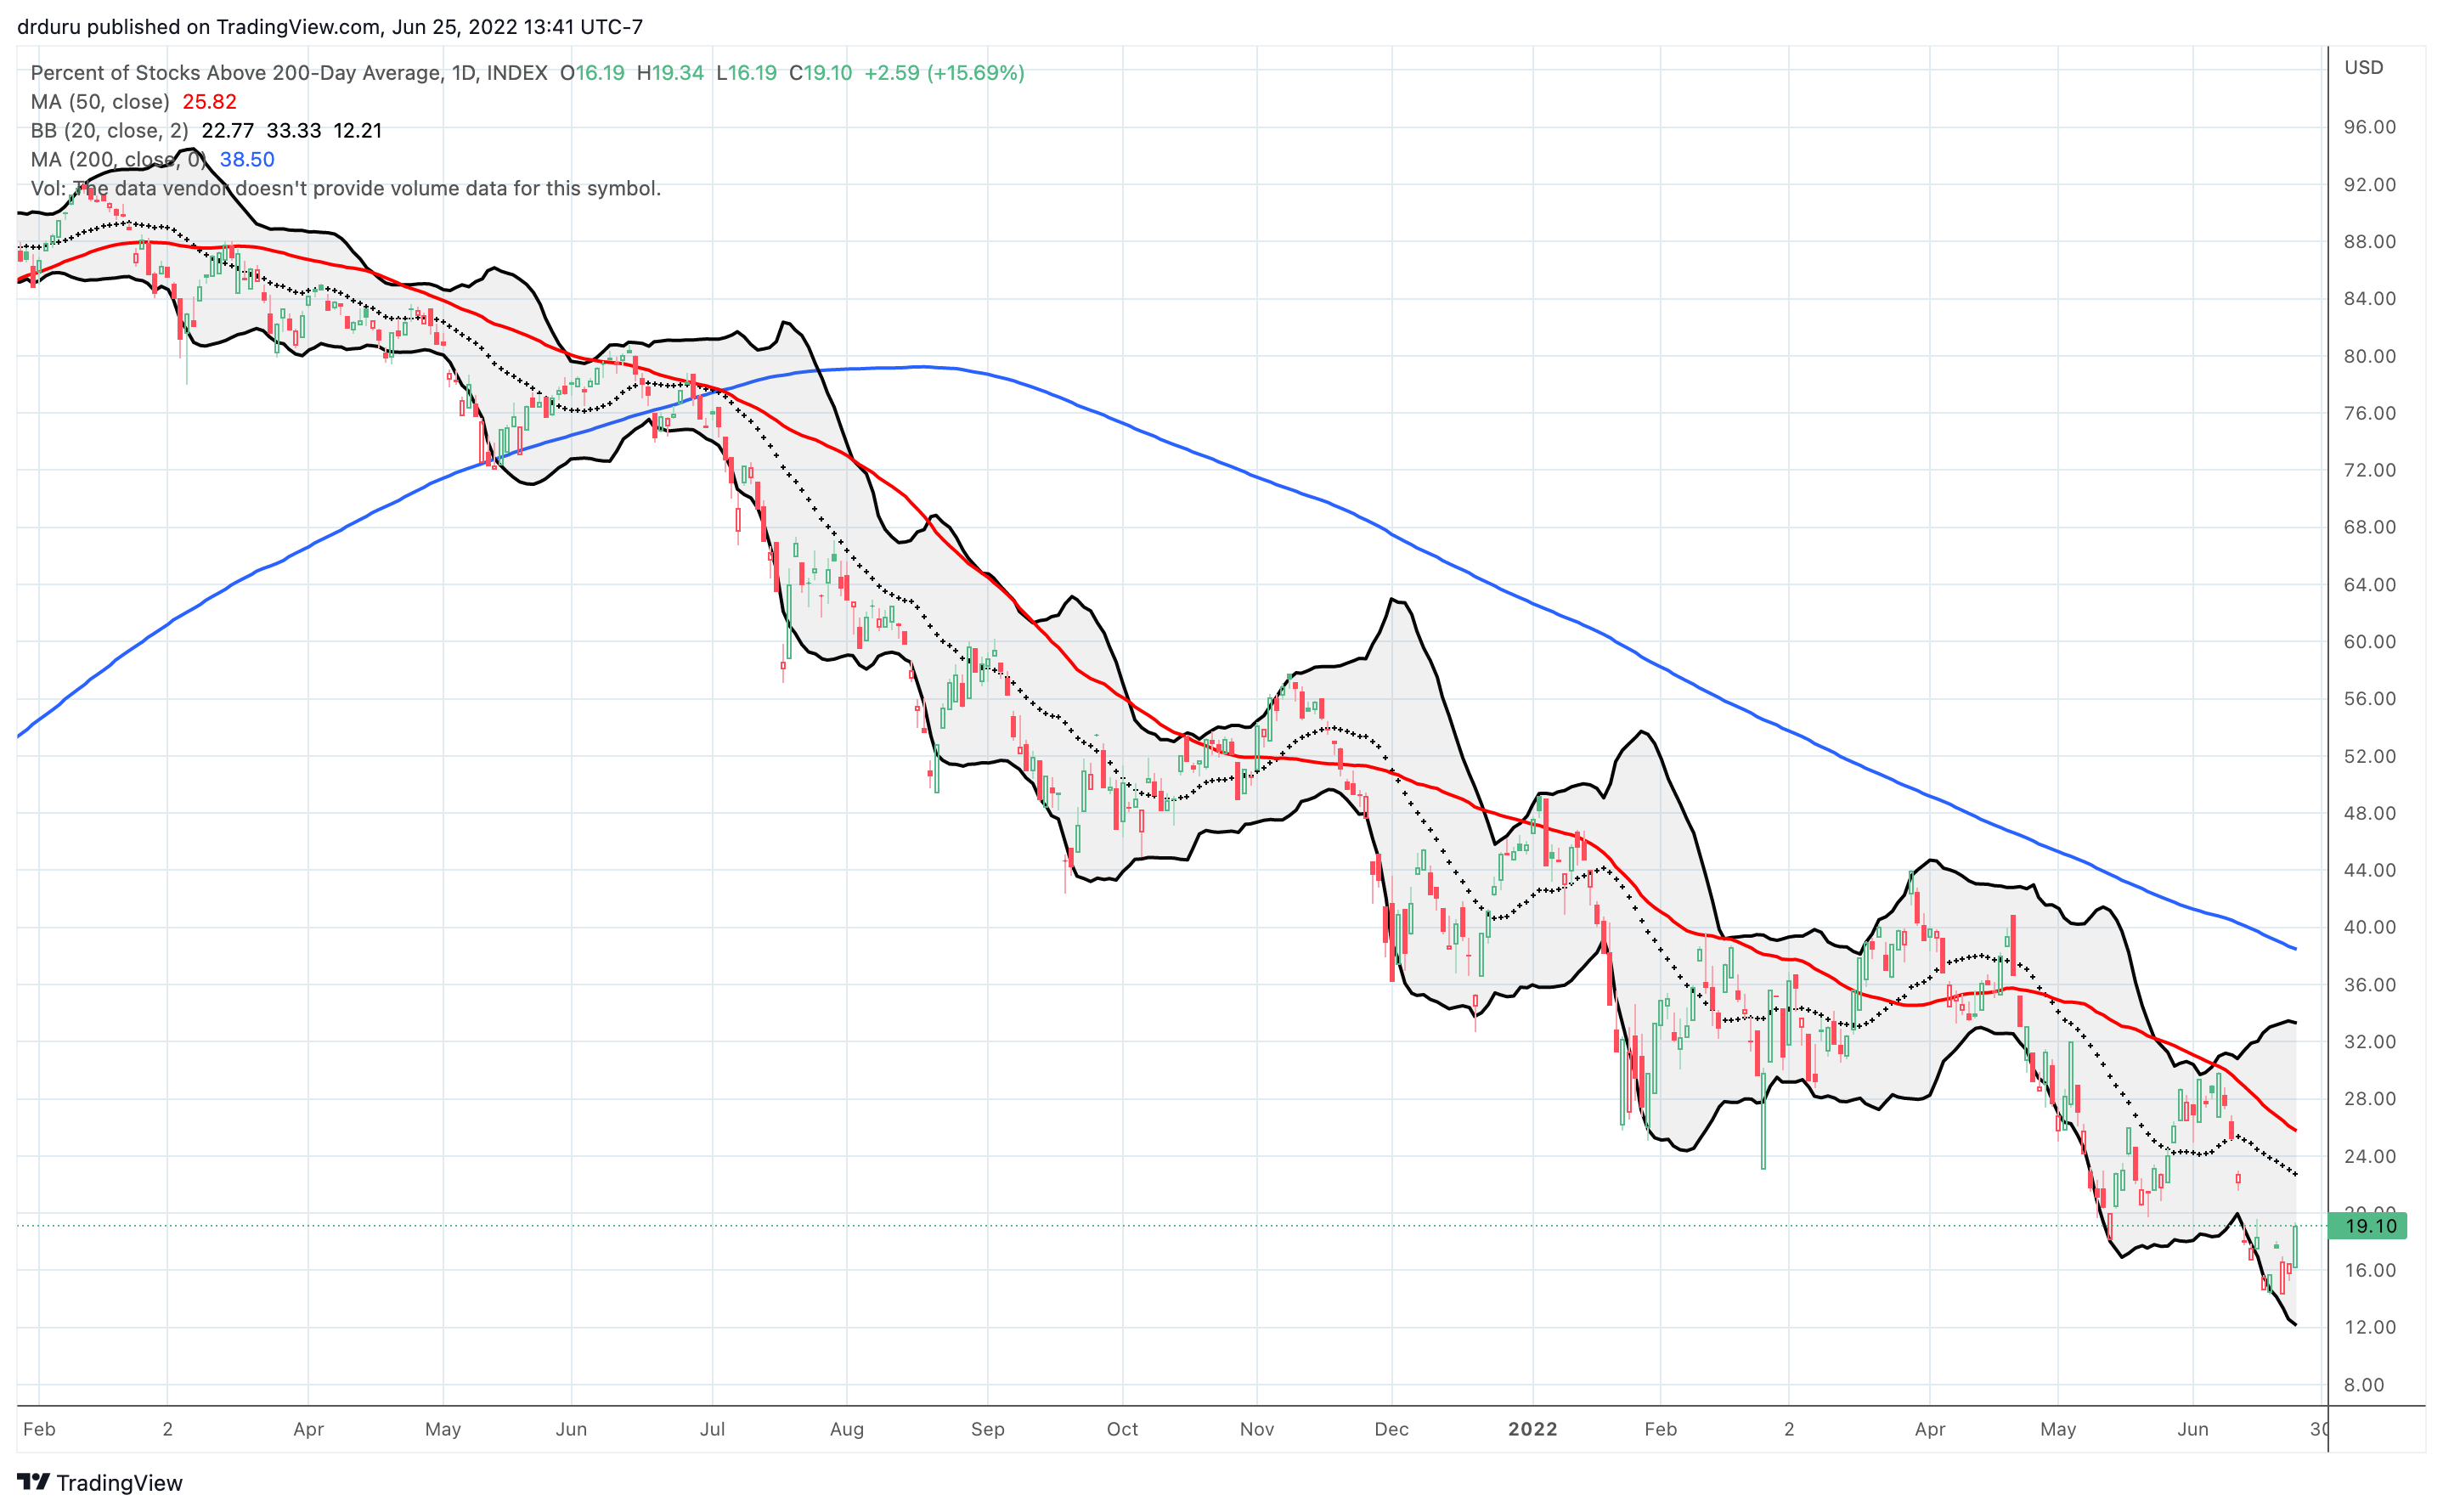
- AT200 (MMTH) = 19.1% of stocks are trading above their respective 200-day moving averages
- Short-term Trading Call: cautiously bullish
AT50 (MMFI), the percentage of stocks trading above their respective 50DMAs, printed a convincing follow-through to Wednesday’s surprising end to oversold conditions. AT50 went from 20.0% to 32.0% and confirmed buying force in the stock market. Most importantly, my favorite technical indicator also has upside room before its next challenge: the June highs. Accordingly, the indices have “buy the dip” opportunities with downtrends in sight. These opportunities are tightly defined between the key support levels described earlier and the downtrends in sight formed by the declining 50DMAs.
In anticipation of continued momentum at least into the end of the quarter, I did limited profit-taking and did not add to hedges. I sold my fist full of ARKF call options. In hindsight, I was under-invested in SPY positions and should have had shares to sell into Friday’s close.
Be careful out there!
Footnotes
“Above the 50” (AT50) uses the percentage of stocks trading above their respective 50-day moving averages (DMAs) to measure breadth in the stock market. Breadth defines the distribution of participation in a rally or sell-off. As a result, AT50 identifies extremes in market sentiment that are likely to reverse. Above the 50 is my alternative name for “MMFI” which is a symbol TradingView.com and other chart vendors use for this breadth indicator. Learn more about AT50 on my Market Breadth Resource Page. AT200, or MMTH, measures the percentage of stocks trading above their respective 200DMAs.
Active AT50 (MMFI) periods: Day #3 over 20%, Day #1 over 30% (overperiod ending 9 days under 30%), Day #12 under 40%, Day #56 under 50%, Day #61 under 60%, Day #332 under 70%
Source for charts unless otherwise noted: TradingView.com
Full disclosure: long QQQ put spread; long SPY call spread
FOLLOW Dr. Duru’s commentary on financial markets via StockTwits, Twitter, and even Instagram!
*Charting notes: Stock prices are not adjusted for dividends. Candlestick charts use hollow bodies: open candles indicate a close higher than the open, filled candles indicate an open higher than the close.

