Stock Market Commentary
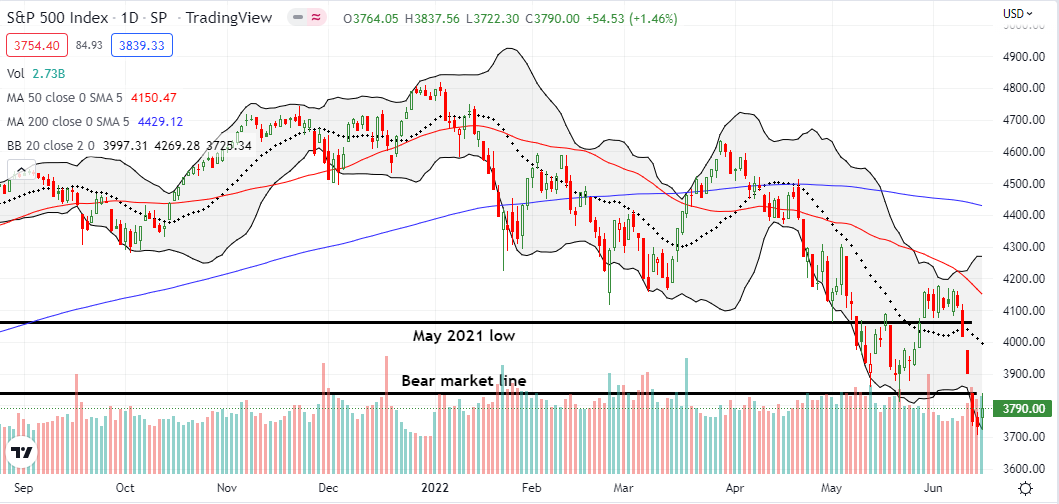
The rumors were true. The Federal Reserve decided to pump up interest rates by 75 basis points (bps) (0.75%) instead of the 50 bps originally anticipated by financial markets. The historic move was the largest point increase since 1994. During the press conference explaining the latest decision on monetary policy, Chair Jerome Powell claimed that Friday’s inflation report changed the calculus for the Fed. Powell is uncertain what the future holds, but he is confident in the Fed’s ability to continue leaning aggressively against inflation. The stock market “cheered” and heaved a sigh of relief although Powell showed absolutely zero concern for the pain in financial markets. The mood shift was enough to push the S&P 500 right back to the bear market boundary that shattered in the wake of the leaked 75 bps news. Still, the path ahead holds more churn and spills as inflation promises to fight its own good fight against the economy.
The Stock Market Indices
On Monday, the S&P 500 (SPY) decisively sliced its way into bear market territory. Today, the index tentatively tested the bear market boundary. Buyers cheered the Fed’s decision, but lacked enough energy to take the S&P 500 out of bear market territory. Instead, the index faded back and clung to a 1.5% gain.
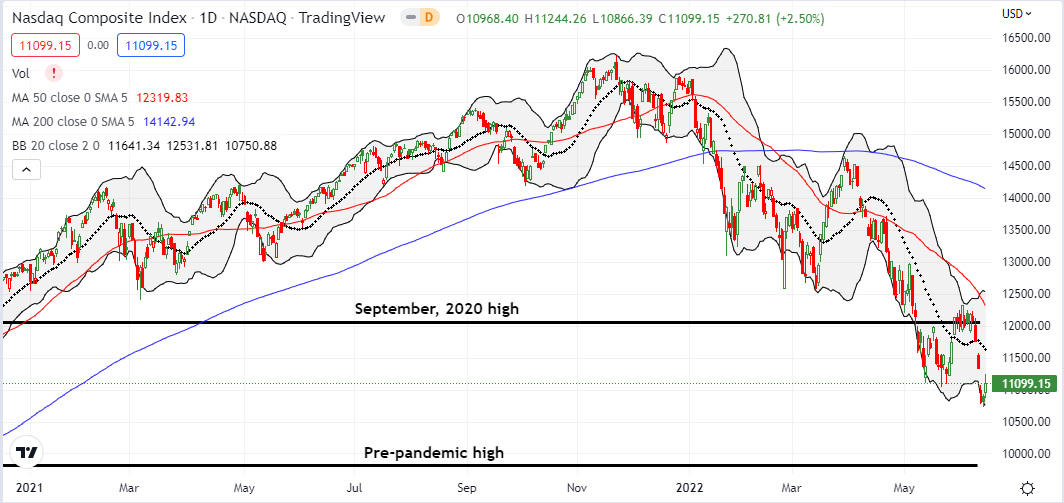
The NASDAQ (COMPQX) jumped into Monday’s large gap down but failed to close above the previous closing low for the year. The day’s intraday fade still left the tech-laden index with a healthy 2.5% gain. A close above today’s intraday high would add to the bullish case for an oversold bounce back to the declining 20-day moving average (DMA) or even the September, 2020 pivot point.
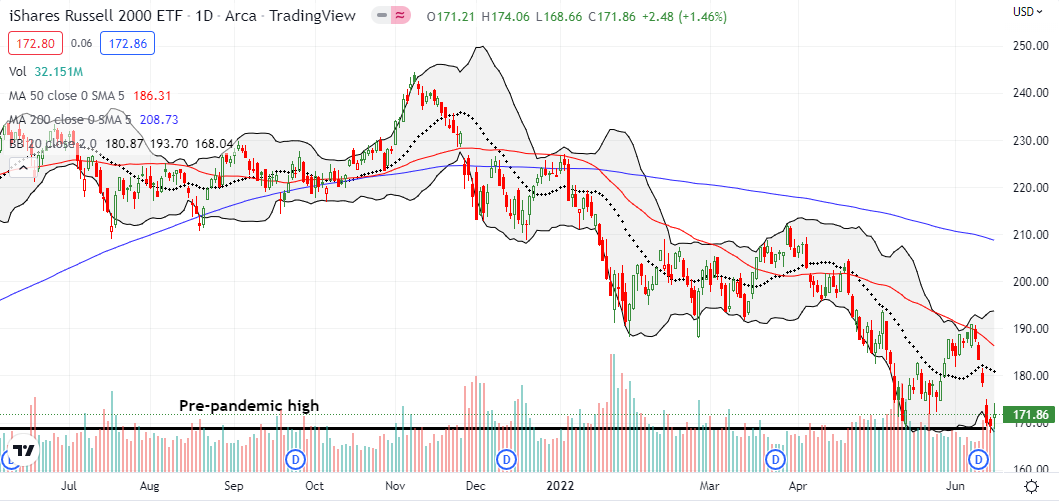
The iShares Russell 2000 ETF (IWM) had the most constructive pattern of trading. The ETF of small caps effectively bounced off support from the pre-pandemic high. IWM needs to close above the week’s intraday high to put an extended oversold bounce into play with a retest of the 20DMA or even the 50DMA (the red line).
Stock Market Volatility
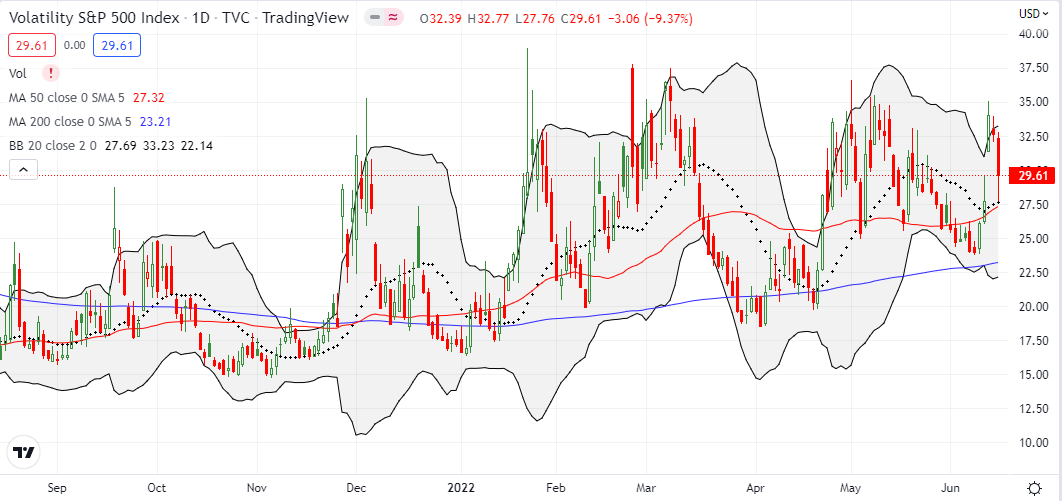
The volatility index (VIX) failed once again to crack the code of recent highs. The day’s 9.4% loss confirmed overhead resistance from those highs. Even as I expect a lot of churn ahead, I am getting more and more willing to assume a 35.0-37.5 top for the VIX absent some new bad news.
The Short-Term Trading Call With A Bear Market
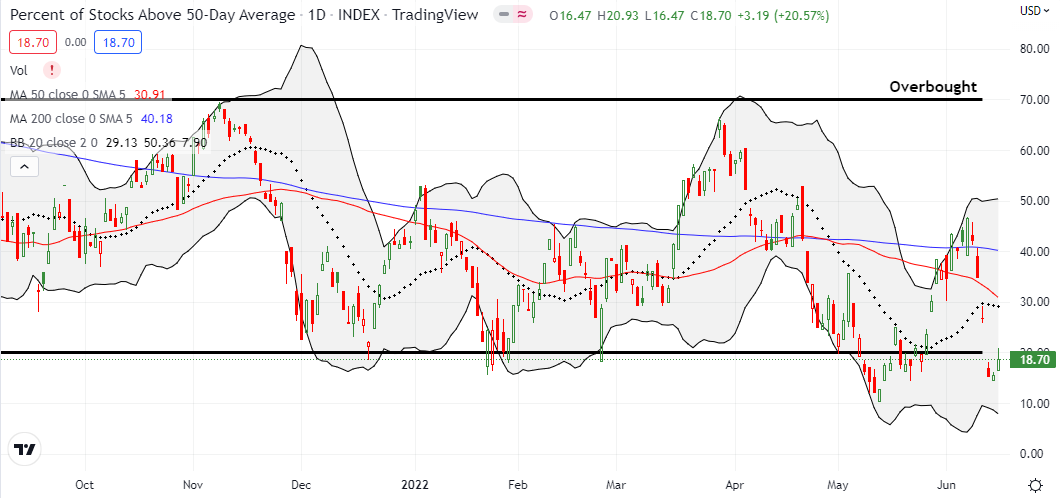
- AT50 (MMFI) = 18.7% of stocks are trading above their respective 50-day moving averages (oversold day #3)
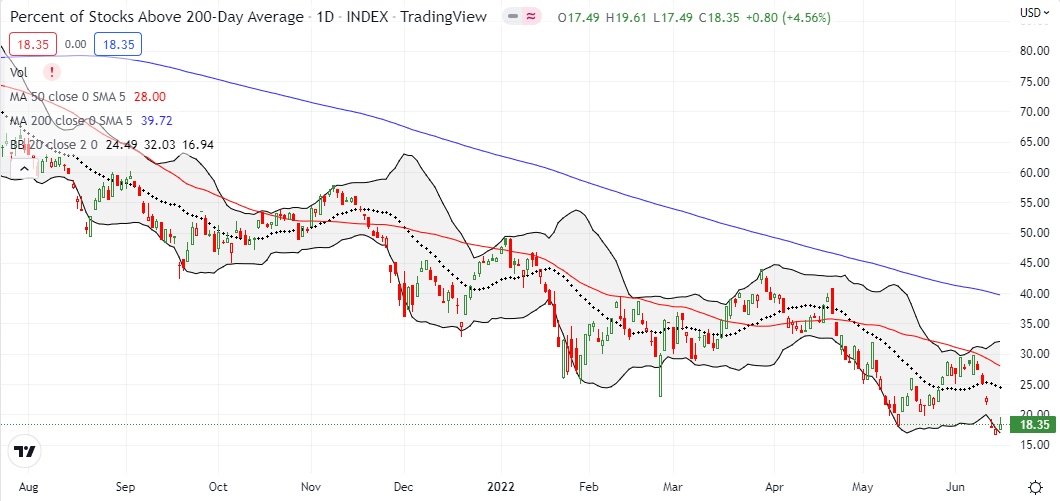
- AT200 (MMTH) = 18.4% of stocks are trading above their respective 200-day moving averages
- Short-term Trading Call: cautiously bullish
AT50 (MMFI), the percentage of stocks trading above their respective 50DMAs, briefly broke out of oversold territory. My favorite technical indicator faded with the indices and settled on a small gain and close at 18.7%. This retreat sets up an important post-Fed trading period. I often look for a fade of the initial post-Fed reaction. With oversold conditions in play, I will treat such a fade as a buying opportunity. The oversold period is extended enough to warrant a little more aggressiveness on the long side.
A tweet reporting historical data on S&P 500 bear markets gave me reason to take a pause. Notably, bear markets are extremely rare. The chart below is missing the brief (thank you, Fed!) bear market from 2020 (perhaps because it was so short). Nevertheless, the point is clear. Bear markets tend to be long affairs with churn and pain. If history plays out again, then traders can expect a series of oversold periods ahead. Dips into oversold territory are buyable. However, the rebounds out of oversold will need to be sold. This prescription will apply until the S&P 500 manages to break out above its 50DMA.
My few tentative trades on the day reflect my short-term optimism for an oversold bounce and wariness about future failures to break completely free of the bear market boundary.
- HYG Jul 15 ’22 $73 Put
- ARKF Jul 15 ’22 $17 Call
- ARKK Jun 17 ’22 $36 / ARKK Jul 15 ’22 $37 calendar put spread
Be careful out there!
Footnotes
“Above the 50” (AT50) uses the percentage of stocks trading above their respective 50-day moving averages (DMAs) to measure breadth in the stock market. Breadth defines the distribution of participation in a rally or sell-off. As a result, AT50 identifies extremes in market sentiment that are likely to reverse. Above the 50 is my alternative name for “MMFI” which is a symbol TradingView.com and other chart vendors use for this breadth indicator. Learn more about AT50 on my Market Breadth Resource Page. AT200, or MMTH, measures the percentage of stocks trading above their respective 200DMAs.
Active AT50 (MMFI) periods: Day #3 under 20% (oversold), Day #4 under 30%, Day #6 under 40%, Day #50 under 50%, Day #55 under 60%, Day #326 under 70%
Source for charts unless otherwise noted: TradingView.com
Full disclosure: long QQQ put spread and calls; long SPY call spread, long IWM call spread, ARKF calls, HYG puts, ARKK put calendar spreads
FOLLOW Dr. Duru’s commentary on financial markets via StockTwits, Twitter, and even Instagram!
*Charting notes: Stock prices are not adjusted for dividends. Candlestick charts use hollow bodies: open candles indicate a close higher than the open, filled candles indicate an open higher than the close.
