
Housing Market Intro and Summary
The home builder stock buying season started on a firm foundation. November delivered strong follow-through across a broad range of housing-related stocks even as the housing data settles into a period of normalization. Demand for new and existing homes is well off last year’s heated levels. Supply remains extremely tight for existing homes but is more plentiful for new homes even as starts float downward. The median price for new homes has finally flattened out month-over-month after soaring at a blistering pace. Housing sits at a nexus of an on-going economic recovery and rising inflation concerns which are weighing heavily on consumer sentiment. As long as interest rates remain low, housing demand should continue at current normalized levels… and keep housing prices elevated.
Monetary policy in 2022 looms as the largest wildcard for the housing market. The last rate hike cycle had an immediate and outsized impact on the housing market. So perhaps it is no surprise that, so far, the Fed is promising to leave interest rates alone for the foreseeable future.
On the policy side, President Biden’s “Build Back Better” Act may have significant impact on the availability of housing to millions of Americans starting in 2022. I conclude this Housing Market Review with a quick look at the bill that just passed the House of Representatives.
Housing Stocks
The iShares Dow Jones US Home Construction Index Fund (ITB) returned to out-performance with an 8.7% gain in October versus the 6.9% gain in the month for the S&P 500 (SPY). The performance gap widened in November. To-date, ITB is up 9.2% versus the 2.1% gain for the S&P 500. The seasonally strong period for home builder stocks is off to an incredibly hot start!
I continue to cast a wary eye toward LGI Homes (LGIH). While LGI Homes nearly recovered all its post-earnings losses, the momentum stopped cold at technical resistance from the 200-day moving average (DMA). As a result, LGIH’s recent under-performance versus ITB worsened in November. LGIH last made an all-time high June 1st. At that time, LGIH was way ahead of ITB for the year: 77.8% versus 28.7%. LGIH is still up 38.4% year-to-date.
Housing Data
New Residential Construction (Single-Family Housing Starts) – October, 2021
Single-family home starts decreased to 1,039,000 which was 3.9% below September’s starts (revised slightly higher). Starts were 10.6% below last year’s levels. As starts continue to normalize back into the pre-pandemic trend, the year-over-year comparisons will worsen. Accordingly, until the next Spring selling season, sequential changes in starts will be more important indicators. Starts still seem to be stabilizing above the 1,000,000 mark.
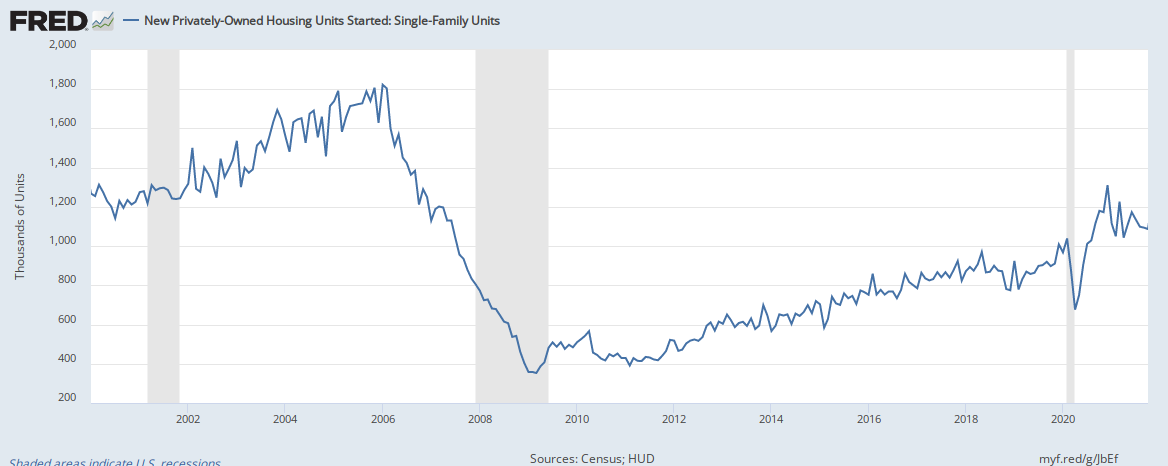
Three of four regions experienced year-over-year declines in starts. The Northeast managed to hold flat. Housing starts in the Northeast, Midwest, South, and West each changed 0.0%, -19.0%, -8.7%, -12.6% respectively year-over-year. All four regions declined sequentially.
Existing Home Sales – October, 2021
Existing home sales staged a sharp comeback in September but still registered a year-over-year loss. Gains continued into October despite an on-going normalization from the red hot market a year ago. The seasonally adjusted annualized sales in October of 6.34M increased 0.8% month-over-month from the unrevised 6.29M in existing sales for September. Year-over-year sales decreased 5.8%.
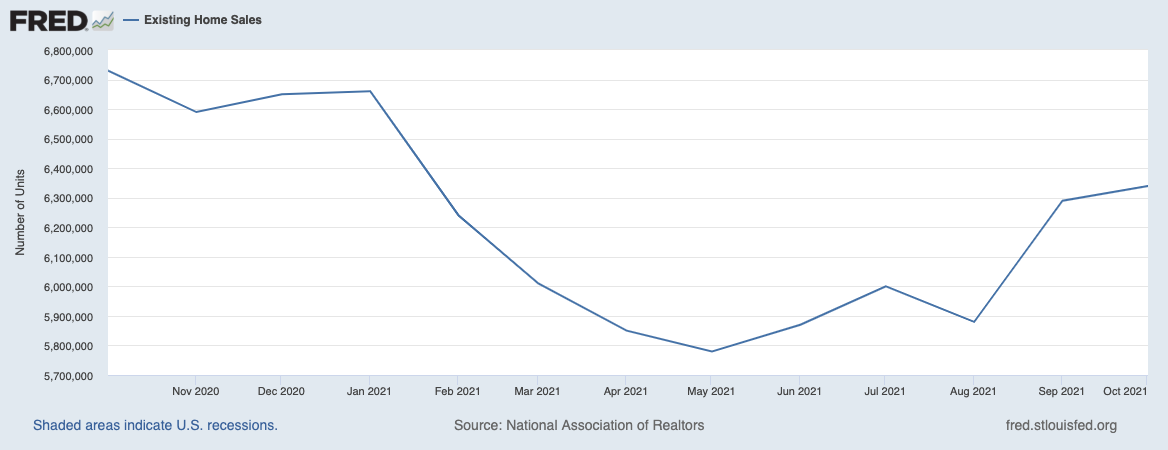
(For historical data from 1999 to 2014, click here. For historical data from 2014 to 2018, click here) Source for chart: National Association of Realtors, Existing Home Sales© [EXHOSLUSM495S], retrieved from FRED, Federal Reserve Bank of St. Louis, November 22, 2021.

October’s absolute inventory level of 1.25M homes decreased 0.8% from September. This third consecutive month-over-month decline completed the contrast with the previous month’s claim from the National Association of Realtors (NAR) that “Some improvement in supply during prior months helped nudge up sales in September.”
Inventory dropped 12.0% year-over-year (compare to September’s 13.0%, August’s 13.4%, July’s 12.0%, June’s 18.8%, May’s 20.6%, April’s 20.5%, March’s 28.2%, February’s 29.5%, January’s 25.7%, and December’s 23% year-over-year declines, unrevised). “Unsold inventory sits at a 2.4-month supply at the current sales pace, equal to September’s supply, and down from 2.5 months in October 2020.” The on-going year-over-year decline in inventory is on a 29-month streak.
The average 18 days it took to sell a home in October was the first change since the duration dropped to 17 in April.
The median price of an existing home ended a 3-month decline and increased 0.8% from September. Prices have increased year-over-year for 116 straight months which the NAR acknowledged as an all-time record streak. October’s price hike was a 13.1% year-over-year gain. Existing home sales are sitting at a nexus between the recovery keeping demand relatively strong and prices elevated against limited supply.
First-time home buyers increased to a 29% share of sales in October, up from 28% in September. The NAR’s 2017 Profile of Home Buyers and Sellers reported an average of 34% for 2017, 33% for 2018, 33% for 2019, and 31% for 2020. Investors also picked up their pace. Their share of sales increased from 13% to 17%.
Just two regions increased sales month-over-month. All four regions experienced year-over-year sales declines. The regional year-over-year changes were: Northeast -13.8%, Midwest -6.3%, South -3.5%, West -5.1%.
As usual, all regions registered robust year-over-year price gains: Northeast +6.4%, Midwest +7.8%, South +16.1%, West +7.7%.
Single-family home sales increased 1.3% from September and declined on a yearly basis by 5.8%. The median price of $360,800 was up 13.5% year-over-year.
California Existing Home Sales – October, 2021
California’s normalization process showed up in sales but not inventory. The pricing picture was a mixed bag. The California Association of Realtors (C.A.R.) commented: “Slower sales activity suggests that the market is returning to its typical seasonal pattern and further market normalization can be expected in the upcoming months. While the market is showing signs of cooling off in recent months, 2021 continues to outpace last year’s sale level so far and is expected to post a gain at year-end.”
Overall, existing homes sales decreased 0.9% month-over-month and marked 5 losing months over the last 6. For October, C.A.R. reported 438,190 in existing single-family home sales. Sales decreased 10.4% year-over-year (similar to September’s year-over-year decline). At $798,440 the median price dropped for the second month in a row coming off August’s all-time high. The median was still up 12.3% year-over-year. The $389 price per square foot was $4 down from September but still up 19.3% year-over-year. Moreover, 60.2% of homes still sold above asking price (the lowest percentage since February).
Inventory fell along with slowing sales. The Unsold Inventory Index (UII) dropped from 1.9 to 1.8 months of sales. The UII was 2.0 a year ago. Active listings fell 18.3% year-over-year. The median time it took to sell a house increased month-over-month for the first time in over TWO years.
In the September report, the C.A.R. guessed that the off-season will offer buyers more options and more incentive to buy. I still believe that the process of normalization will continue unabated without material increases in inventory and significant price declines. The October report bears out my expectations.
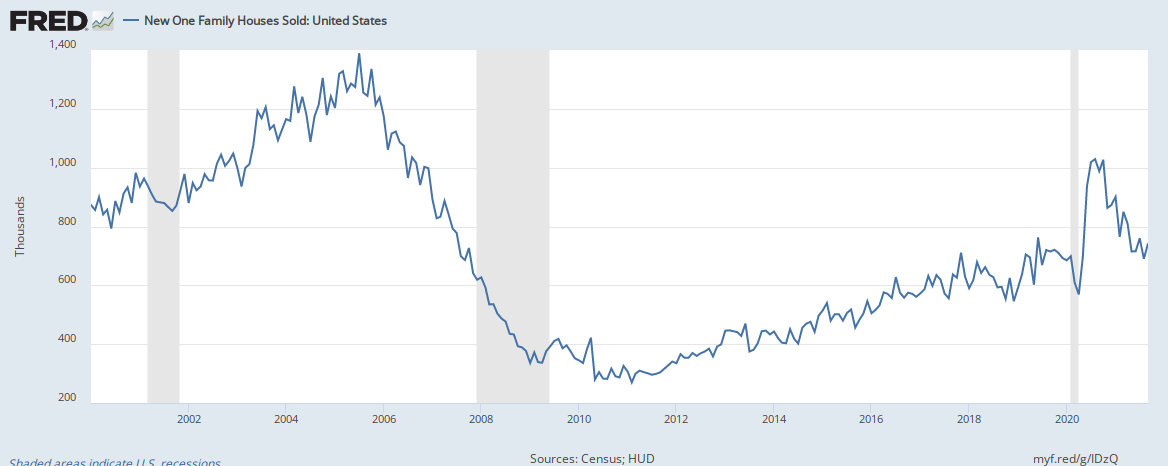
New Residential Sales (Single-Family) – October, 2021
New home sales have cooled off from the early pandemic craze. They are still on the overall uptrend in place since the trough following the financial crisis. New home sales of 745,000 were up 0.4% from September’s 742,000 (significantly revised down from 800,000). Sales were down 23.1% year-over-year.
At $407,700 the median home price set a an all-time high by $100. The run-up in prices since the pandemic is truly extraordinary. The median price was already around all-time highs ahead of the pandemic but was relatively steady for 2 1/2 years. The recent price acceleration is far sharper than the price appreciation from the housing bubble. I am not surprised that consumer sentiment keeps falling given living costs are soaring in this way.
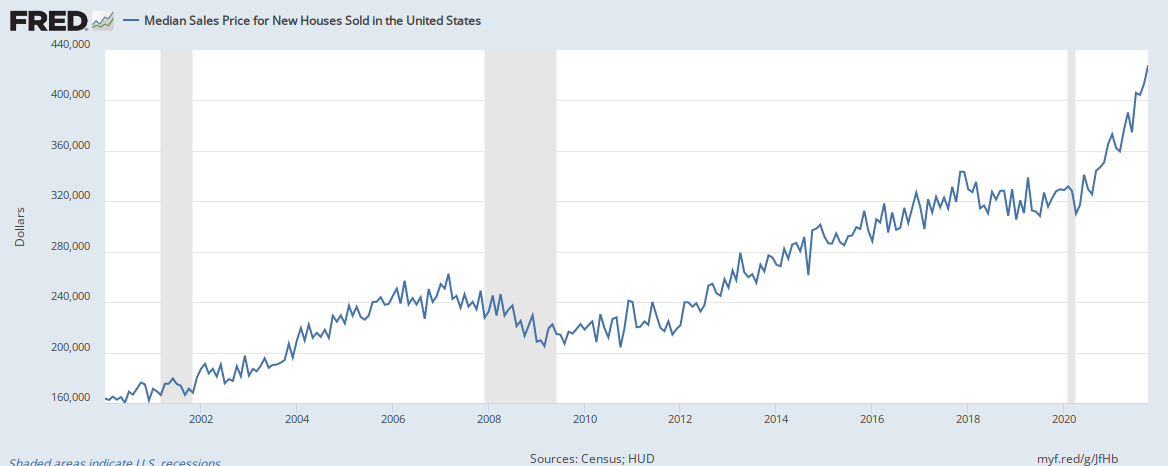
The monthly inventory of new homes for sale increased from 5.7 to 6.3. The absolute inventory level of 389,000 delivered a third month of gains. Perhaps the uptick in inventory is helping to flatten out the price curve…for now.
Sales in three of four regions declined significantly year-over-year. The Northeast returned to declines with a sharp drop of 26.8%. The Midwest plunged 28.3%. The South dropped 16.7%. The West declined 33.1%.
Home Builder Confidence: The Housing Market Index – November , 2021
After a 5-point drop in July, the NAHB/Wells Fargo Housing Market Index (HMI) from the National Association of Home Builders (NAHB) looked like trouble. However, I claimed that the decline simply represented some long overdue normalization. November’s sharp bounce to 83 likely confirmed a bottom in the HMI at August’s 75. For the second month in a row, each of the components of the HMI increased. Builder confidence continues to rebound despite consumer confidence now sinking below the pandemic lows. This divergence is not a problem as long as consumers continue scrambling to buy from a limited inventory of homes. It is difficult to guess right now which sentiment indicator will eventually follow the other. The chart below reminds me that the two have reliably followed each other for at least 17 years.
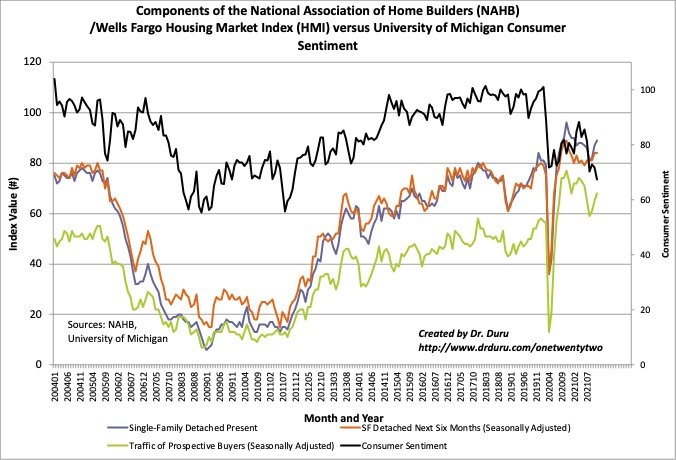
Source for data: NAHB
The NAHB did not offer any new insights to explain the fresh strength in home builder sentiment. Perhaps the rebound in the HMI is surprising to the NAHB given “ongoing supply-side challenges.” The NAHB even offered up fresh reasons for sentiment to weaken: “Lot availability is at multi-decade lows and the construction industry currently has more than 330,000 open positions.” The labor constraints in particular are likely to worsen before improving given the massive spending and investment America is about to make in infrastructure.
Three of four regions enjoyed significant HMI gains. The Northeast dropped back toward its low of the year despite a healthy rebound in October. I have yet to find region-specific explanations for this recent sentiment weakness.
Home closing thoughts
Build Back Better
President Biden included affordable housing in the list of deliverables for his administration’s “Build Back Better” plan. From a recent press release:
“$150 billion investment in housing affordability and reducing price pressures, including in rural areas. Funds go towards building, preserving, and improving more than 1 million affordable rental and single-family homes, including public housing, plus rental and down payment assistance.”
The NAR celebrated the House’s passage of the bill:
“The House-passed bill also includes a $150 billion investment in affordable housing, a key NAR priority and focus of its advocacy efforts for the past year.
In addition, House leaders added back several programs not included in the original framework announcement, including $12 billion to expand the Low-Income Housing Tax Credit and $6 billion for a new initiative, the Neighborhood Homes Investment Act. NAR is a supporter of both programs.”
The NAR also provided details on the proposed allocation of the $150B. There is little that promises to reduce pricing pressures in a systematic way. Instead, the provisions will be most helpful in making more housing available to more people.
The Neighborhood Homes Investment Act “calls for the creation of a new federal tax credit that will produce new equity investment dollars for the development and renovation of 1-4 family housing in distressed urban, suburban, and rural neighborhoods.” This kind of investment provides more supply, at least in places where existing regulations allow for such growth. However, this supply will not relieve the pressures applied by existing demand from buyers who can afford a home but cannot find one.
The NAR tends to support measures that can increase housing transactions. Build Back Better definitely holds out that promise.
Predictably, the NAHB opposes the Build Back Better plan. From the related press release:
“While this bill represents an historic investment in our nation’s housing, NAHB is concerned the tax increases, new building and energy code requirements and increased fines and penalties for OSHA violations would be detrimental to the housing industry during a critical phase in our nation’s economic recovery.”
The NAHB provides even more detail than the NAR about the housing-related provisions in the Build Back Better plan. The NAHB’s list of “good” versus “bad” weighs heavily in favor of the good in the count of benefits, but the tax implications are apparently large enough to outweigh all the good.
I encourage interested readers to review more details in both press releases.
Be careful out there!
Full disclosure: long ITB