The seasonal trade in home builders continues to unfold more like a typical year. The iShares U.S. Home Construction ETF (ITB) peaked in May on an absolute basis and relative to the S&P 500 (SPY). Since that peak, ITB is down 12.2% while the S&P 500 is UP 3.9%. This gap is so wide that I am tempted to get an early start on the seasonal buying period. However, ITB faces an important test of support at its 200-day moving average (DMA) (the blue line below). ITB last closed below this important long-term trend line 15 months ago. A breakdown here would immediately put the July intraday low into play. That low also marks where ITB broke out in March to fresh all-time highs. Accordingly, after repeating a reversal of an important breakout, ITB would quickly become vulnerable to much lower lows.
While a fresh rise in long-term interest rates are once again weighing on housing-related stocks, the most recent housing price data raised the specter of growing affordability problems. However, a report from First American Financial Corporation (FAF) claims that housing affordability at least remains better than the peak of the last housing bubble (emphasis mine):
“In July, housing affordability continued its decline as year-over-year nominal house price appreciation reached a record 20 percent, vastly outpacing the increase in house-buying power compared with a year ago…
However, while affordability declined again in July, it’s helpful to put affordability in historical context. Nationally, nominal house prices in July were 35 percent higher than at the housing boom peak for prices in 2006, yet real, house-buying power-adjusted house prices remain nearly 38 percent below their 2006 housing boom peak.”
Given the 30-year fixed rate mortgage peaked a little over 6% in 2006, the relative affordability advantage is mostly about today’s historic low interest rates. Thus, assuming rates have stopped going down, affordability can only worsen if prices continue to barrel higher. I expect the concerns over affordability to get ever louder next year.
D.R. Horton (DHI)
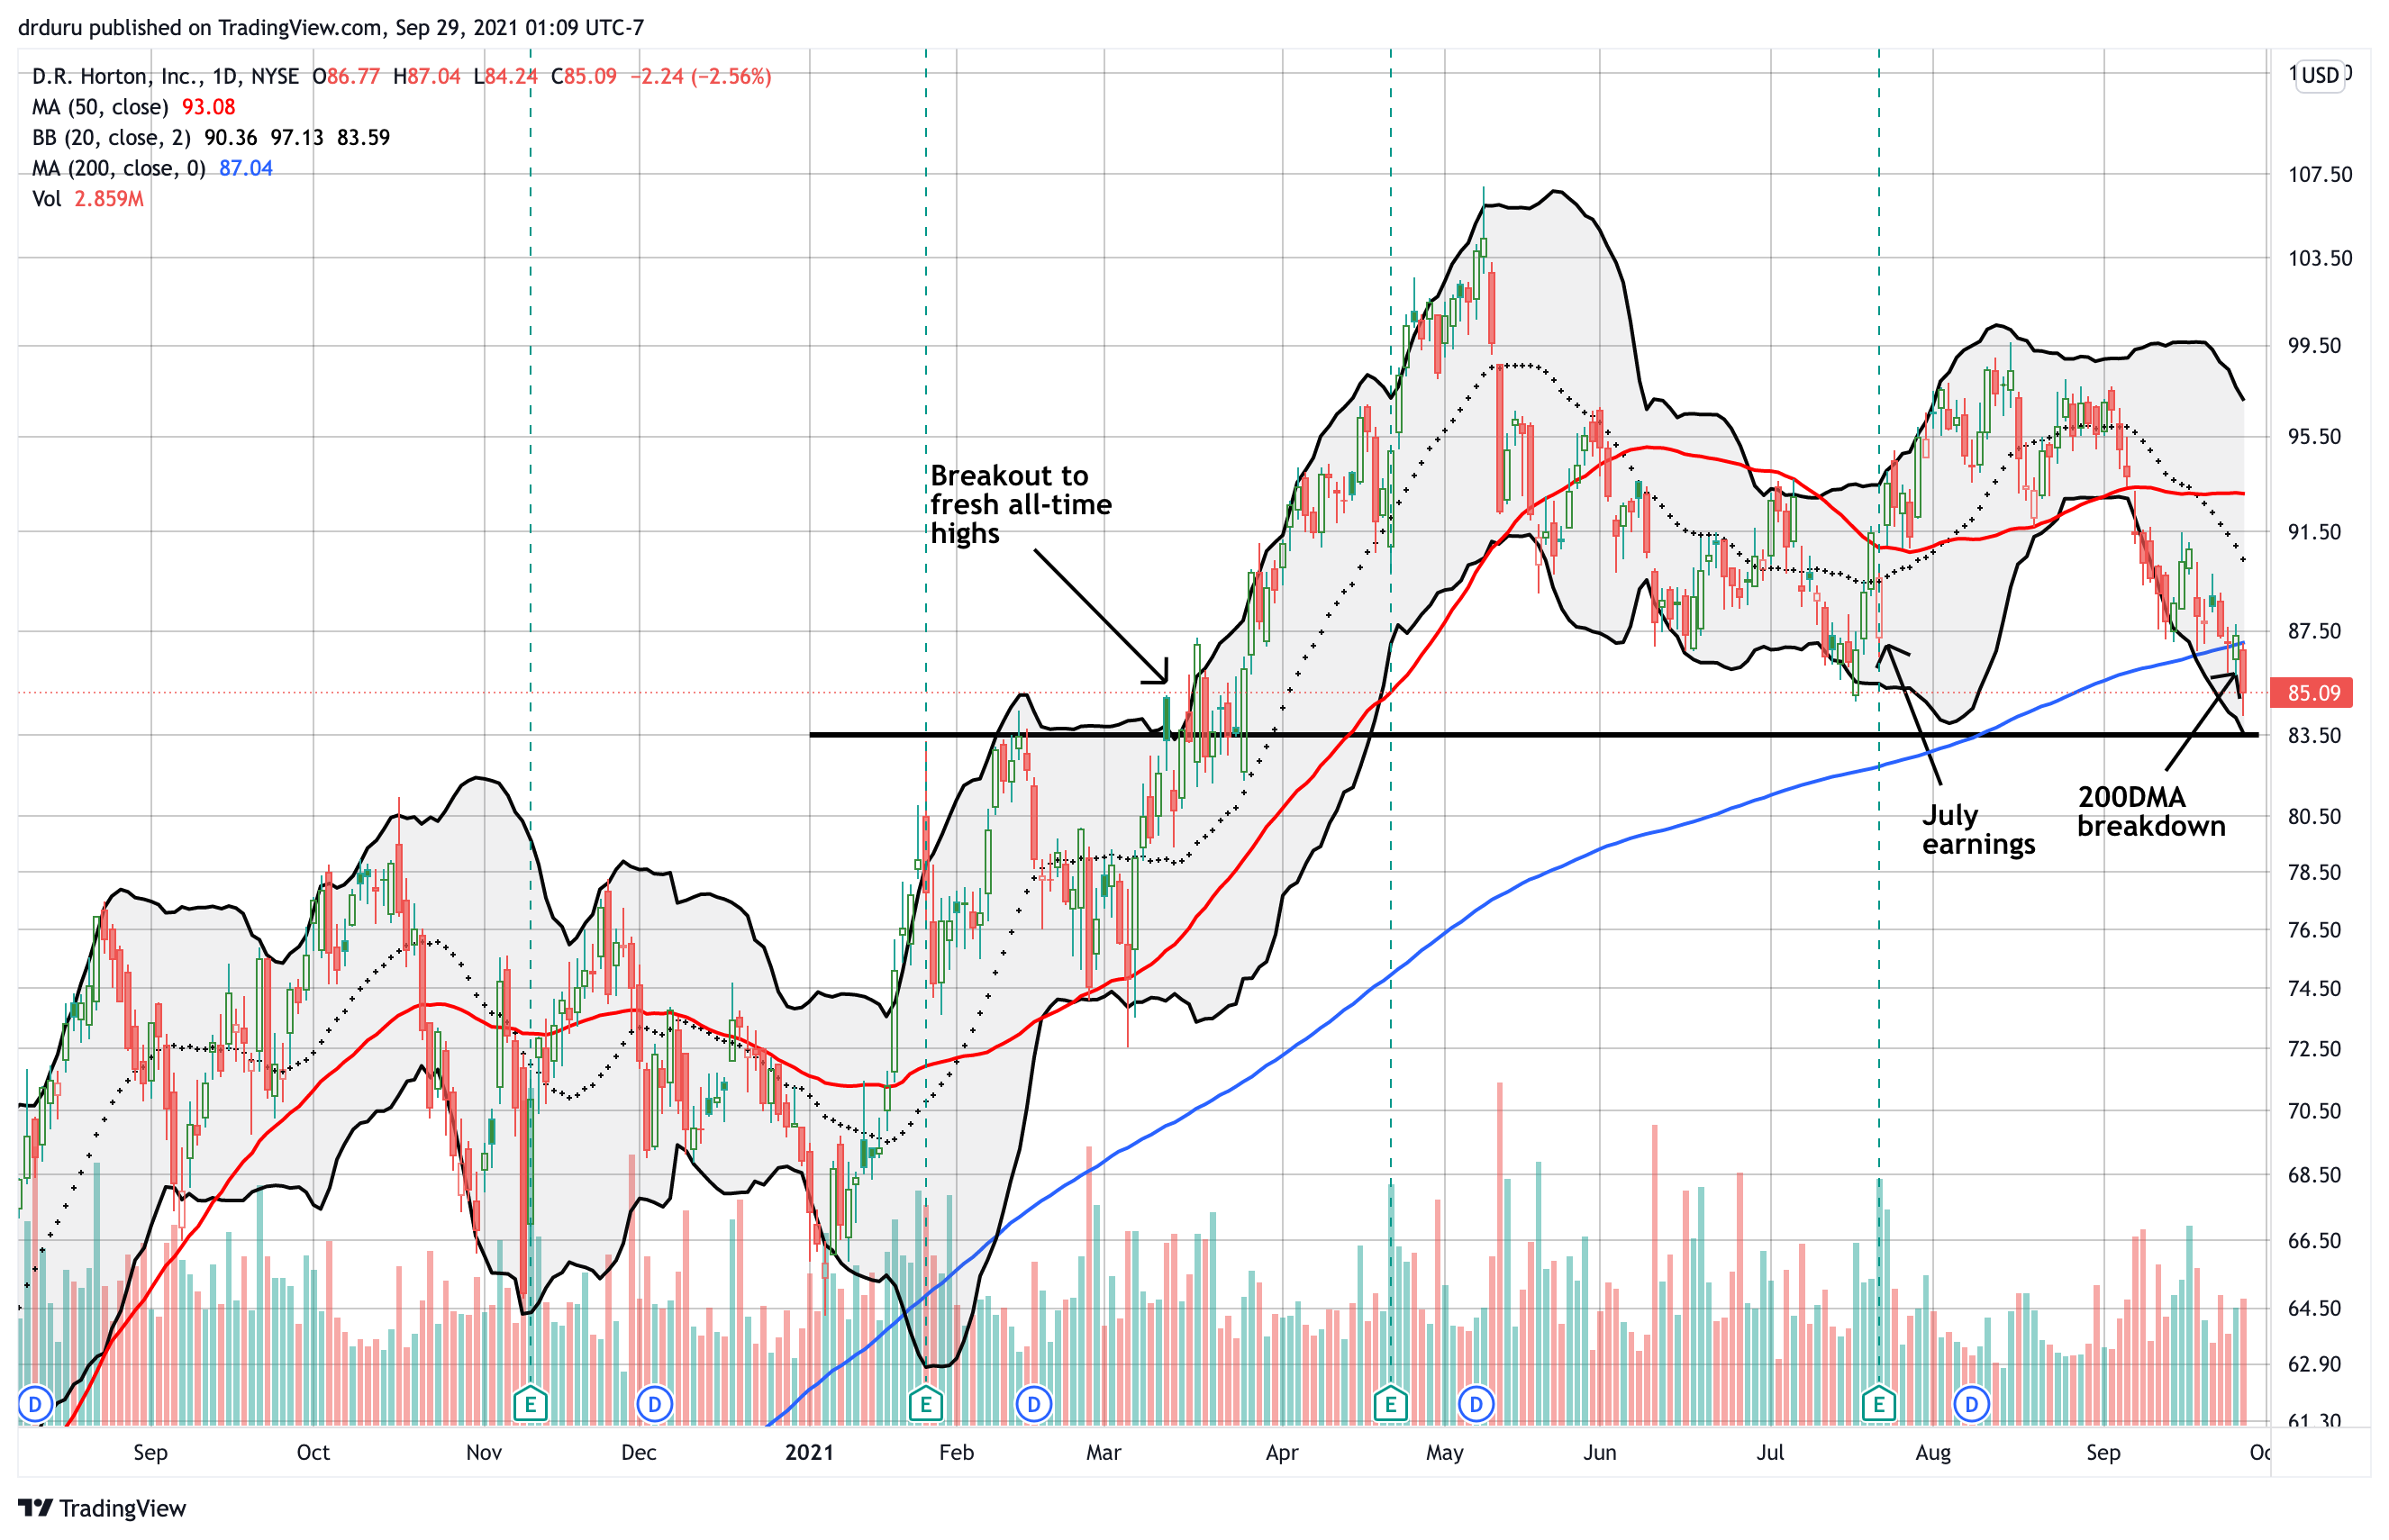
Given ITB is nearing its 200DMA, some components of the index must be below their respective 200DMA. D.R. Horton (DHI) closed at a 4-month low and has the unfortunate distinction of closing below its 200DMA for the first time in 16 months. The stock is one 200DMA breakdown confirmation away from making a run at its March, 2021 lows.

Recall that DHI caused a stir in its earnings report when it joined a growing chorus of home builders announcing slowdowns in the pace of construction. DHI gapped down following the report, but buyers took over from there. With DHI now at a post-earnings low, the negatives from that report will loom larger in the minds of investors.
The Trade
I continue to watch developments with “dry powder” on hand. October is the first official month for buying into the seasonal trade in home builders. With the general stock market under pressure, I assume that October will unfold similarly to September as one of the stock market’s most dangerous months. As a result, I am content to wait for lower prices before pulling out the housing-related shopping list.
Be careful out there!
Full disclosure: no positions
