Stock Market Commentary
The refresher for extended overbought conditions quickly transformed back into a close call. Sellers again created weakening overbought conditions for the stock market with the key indicator hitting the threshold. The minor selling in the major indices may mask a broader deterioration in the technical health of the stock market. Unlike the last close call, this latest drop to the overbought threshold does not come with a large fade of a surge in volatility. In other words, the extended overbought period suddenly looks tenuous all over again.
The Stock Market Indices
The S&P 500 (SPY) only lost 0.2% and even held yesterday’s intraday low as support. Visually, the index looks as solid as ever.
The NASDAQ (COMPQX) also held yesterday’s intraday low as support. The tech-laden index remains clear of the last brief period of consolidation.
Small caps show the clearest sign of trouble. The iShares Trust Russell 2000 Index ETF (IWM) lost 1.9% a day after losing 0.4%. Yesterday, IWM briefly punched through the psychologically important 200 level. A little more selling in IWM will surely weaken the stock market enough to shake it from overbought conditions.
Stock Market Volatility
The volatility index (VIX) stubbornly held support the last two trading days. Today the VIX woke up with a 6.4% gain. The VIX closed well below its levels on the day of the last close call with the overbought threshold. In other words, plenty of room exists for a rapid expansion of selling.
The Short-Term Trading Call: Weakening Overbought Conditions

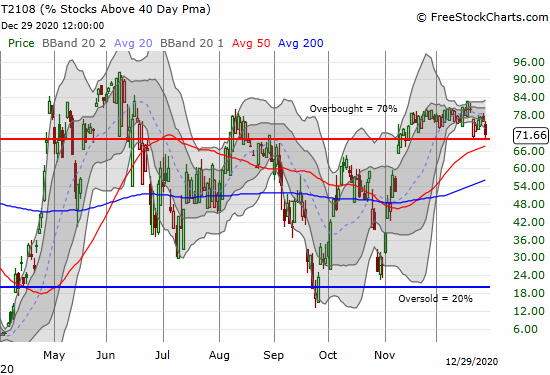
- AT40 = 71.7% of stocks are trading above their respective 40-day moving averages (Day #31 overbought)
- AT200 = 85.6% of stocks are trading above their respective 200-day moving averages TradingView’s calculation).
- Short-term Trading Call: neutral
AT40 (T2108), the percentage of stocks trading above their respective 40DMAs, closed at 71.7%. The S&P 500 and the NASDAQ did not reveal sellers weakening of the overbought period. These indices barely budged while AT40 lost over 5 percentage points. Small caps and the volatility index are key warning signs. Once overbought conditions end, the short-term trading call will flip (cautiously) bearish.
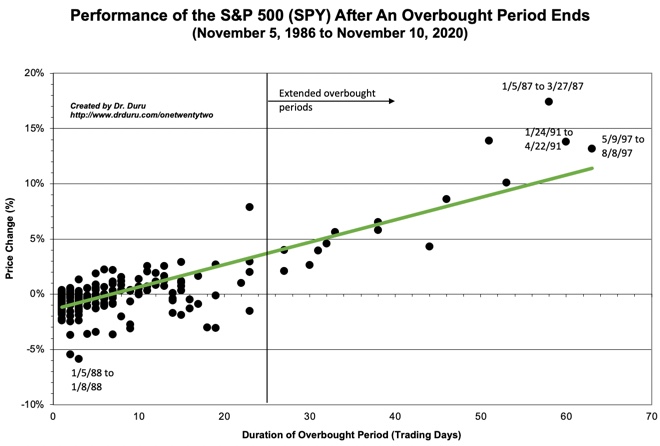
The stock market is on day #31 of overbought conditions. The S&P 500 has 4.0% in gains since overbought trading resumed on November 13th. The slight underperformance in the index per the chart below surprises me given the on-going strength of the stock market (compare to the green trendline).

Stock Chart Reviews – Below the 50DMA
Arcturus Therapeutics Holdings (ARCT)
Just when I think COVID-19 related stocks are essentially played out, drama erupts from somewhere new. Arcturus Therapeutics Holdings (ARCT) lost a gut-wrenching 54.2% after presumably disappointing results from its COVID-19 vaccine trial. Reading that the Singapore Health Sciences Authority gave the company permission to proceed with its trial would have encouraged me if not for the sell-off. The company even positioned its news as very positive:
“We are pleased to advance ARCT-021 into a Phase 2 study based upon our promising Phase 1/2 data, which continues to support the potential for Arcturus’ STARR™ self-replicating mRNA technology to provide a highly effective, and differentiated clinical profile, including a single dose regimen…
ARCT-021, both single administration and prime-boost regimens, are significantly effective in a primate challenge model.”
The stock’s implosion is particularly painful for investors given the company priced a large secondary offering just three weeks ago at $110. This weakening of ARCT brought the stock and company to my attention; I never heard of it before this episode.
Pfizer Inc (PFE)
Pfizer Inc (PFE) is already rolling out its coronavirus vaccine. Yet its stock is showing little enthusiasm. For the second news phase in a row, investors and traders dealt PFE a serious fade after good vaccine news. With no more short-term vaccine positive catalysts ahead, PFE looks a little like dead money. It is even possible that good vaccine news elsewhere will become bad news for PFE’s stock.
Biontech SE (BNTX)
Pfizer partnered with Biontech SE (BNTX) for its coronavirus vaccine. Like PFE, investors are losing some enthusiasm for BNTX. In less than 3 weeks, BNTX has lost 31.5%.
Stock Chart Reviews – Above the 50DMA
Moderna (MRNA)
Like Pfizer, Moderna (MRNA) has launched a COVID-19 vaccine. There are likely no more short-term positive catalysts for the stock, so the current (relatively orderly) pullback makes technical sense. MRNA caught my attention with a perfect bounce off 50DMA support. The trade is simple from here. A 50DMA breakdown is bearish. Follow-through buying is bullish and confirms support.
Emergent Biosolutions (EBS)
The plunge in ARCT got me searching for other COVID-19 related stocks. I used the advanced search in SwingTradeBot to find a list of coronavirus stocks. I saw a lot of speculative names, single digit stocks and the like. Emergent Biosolutions (EBS) caught my attention. The stock in the vaccine manufacturer just survived a 200DMA breakdown. EBS is now positioning for a critical test against converged 20, 50, AND 200DMA support. I am a buyer on a bounce from this support. If EBS breaks its November lows, I will assume the downtrend from the all-time high in August received fresh momentum.
Be careful out there!
Footnotes
“Above the 40” (AT40) uses the percentage of stocks trading above their respective 40-day moving averages (DMAs) to measure breadth in he stock market. Breadth indicates the distribution of participation in a rally or sell-off. As a result, AT40 can identify extremes in market sentiment that are likely to reverse. Above the 40 is my alternative name for “T2108” which was created by Worden. Learn more about T2108 on my T2108 Resource Page. AT200, or T2107, measures the percentage of stocks trading above their respective 200DMAs.
Active AT40 (T2108) periods: Day #54 over 20%, Day #38 above 30%, Day #37 over 40%, Day #36 over 50%, Day #35 over 60%, Day #31 over 70%

Red line: Overbought threshold (70%); Blue line: Oversold threshold (20%). Source: FreestockCharts
Source for charts unless otherwise noted: TradingView.com
Full disclosure: long UVXY, long SPY put spread
FOLLOW Dr. Duru’s commentary on financial markets via StockTwits, Twitter, and even Instagram!
*Charting notes: FreeStockCharts stock prices are not adjusted for dividends. TradingView.com charts for currencies use Tokyo time as the start of the forex trading day.


Thanks again for your data.
I have utilized your work to help
my trading with some success in
my equity and options trades.
That’s great! I always love to hear readers are getting value from these posts. Tell a friend! 🙂