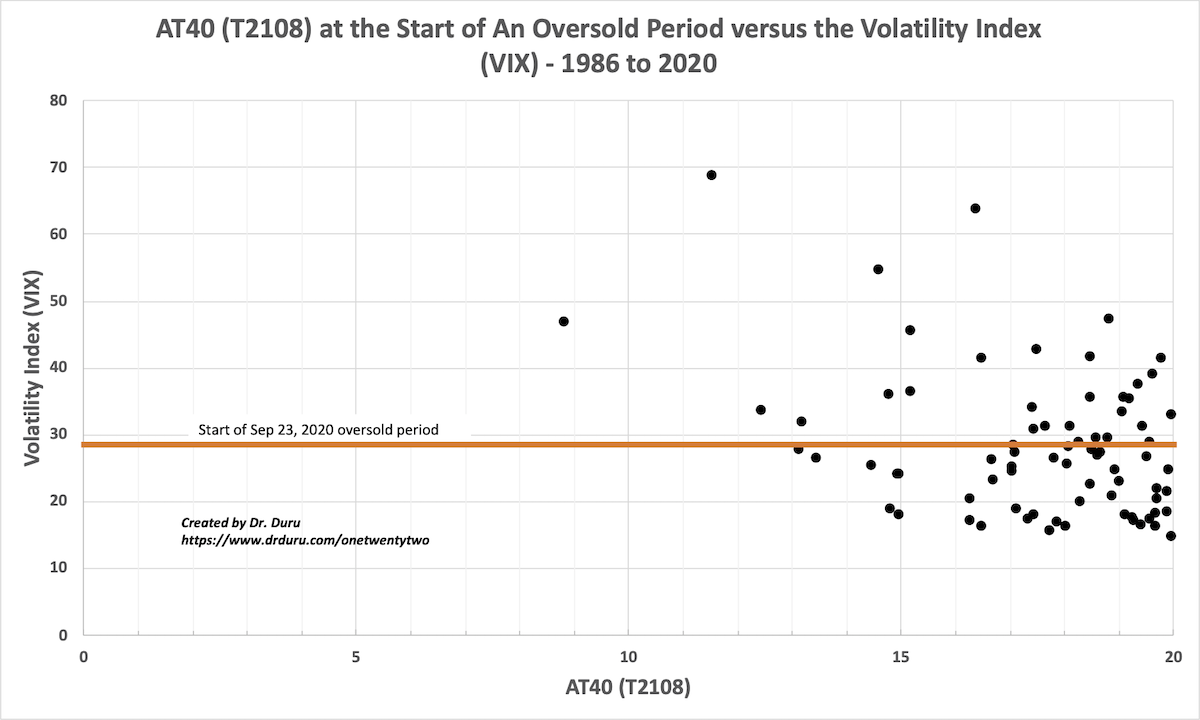
When the stock market last flipped to oversold trading conditions, I expected at least one more spike in the volatility index (VIX) before oversold trading ended. I define oversold as a period of trading in the stock market when AT40 (T2108), the percentage of stocks trading above their respective 40-day moving averages (DMAs), closes below 20%. My expectation for a higher volatility index recognizes the extreme risks facing the stock market in coming weeks and even months. It turns out that volatility in the mid-20s is not low for the start of an oversold period. The chart below compares the volatility index to AT40 from 1986 to April, 2020. The pandemic-driven collapse in the stock market came to an end in April.

The orange line marks the value of the volatility index where the last oversold period began at 19.6%. Of the 77 prior oversold periods, just 30 (39%) began with a VIX greater than 28.6. The last oversold period began with the VIX at 28.6. In other words, the start of this last oversold period was not unusual relative to the VIX.
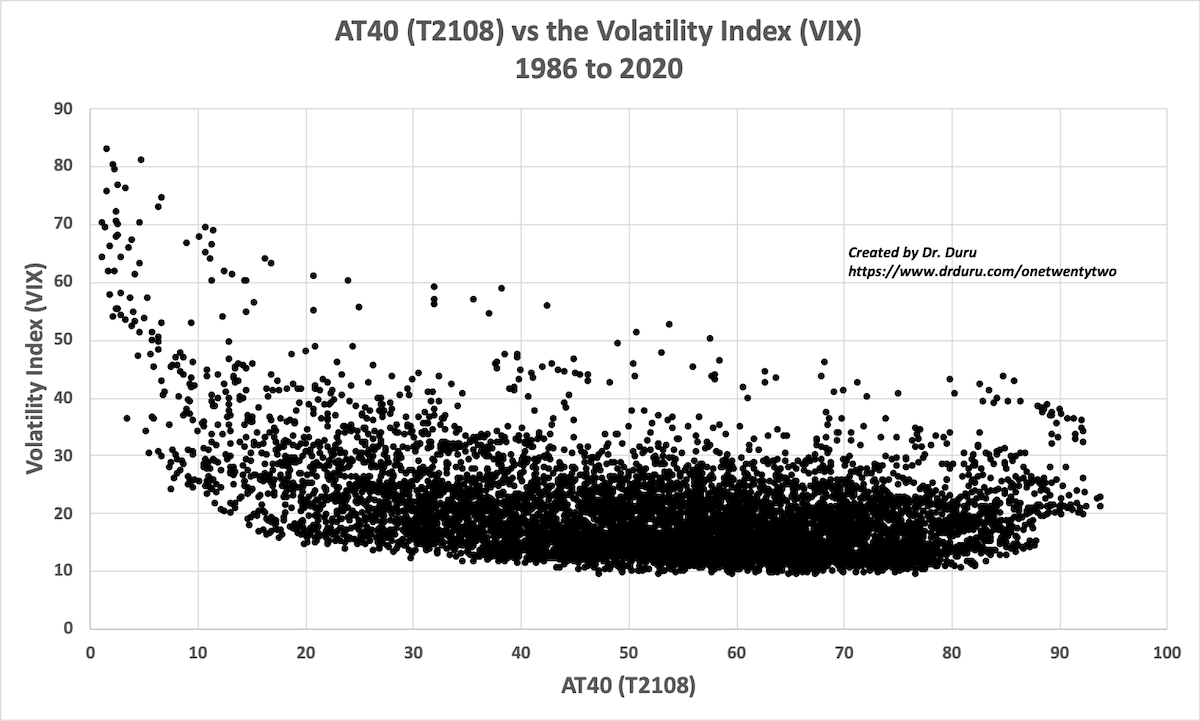
Still, the higher the volatility index rises, the more extreme the oversold period. The chart below maps the VIX to AT40 for ALL trading days. There is a lot randomness between the two measures except at the extremes. The VIX trends higher for AT40 below 20%. So it is no surprise that the stock market’s highest levels of volatility have occurred during oversold periods.

As a result of these data, I will be more interested in the VIX’s behavior after oversold trading begins. The AT40 trading rules are key. A large spike in volatility during an oversold period is a key ingredient for a bottom.
Be careful out there!
Full disclosure: long UVXY
