
The Price Action
Bitcoin (BTC/USD) is on more media radars after breaking out above $10,000 last week. Last month, Bitcoin broke out from a downtrend in place since the last big run-up peaked in June, 2019. The $10K breakout ran into a wall from resistance formed by the high when Bitcoin suddenly spiked straight up October 25-26th last year.
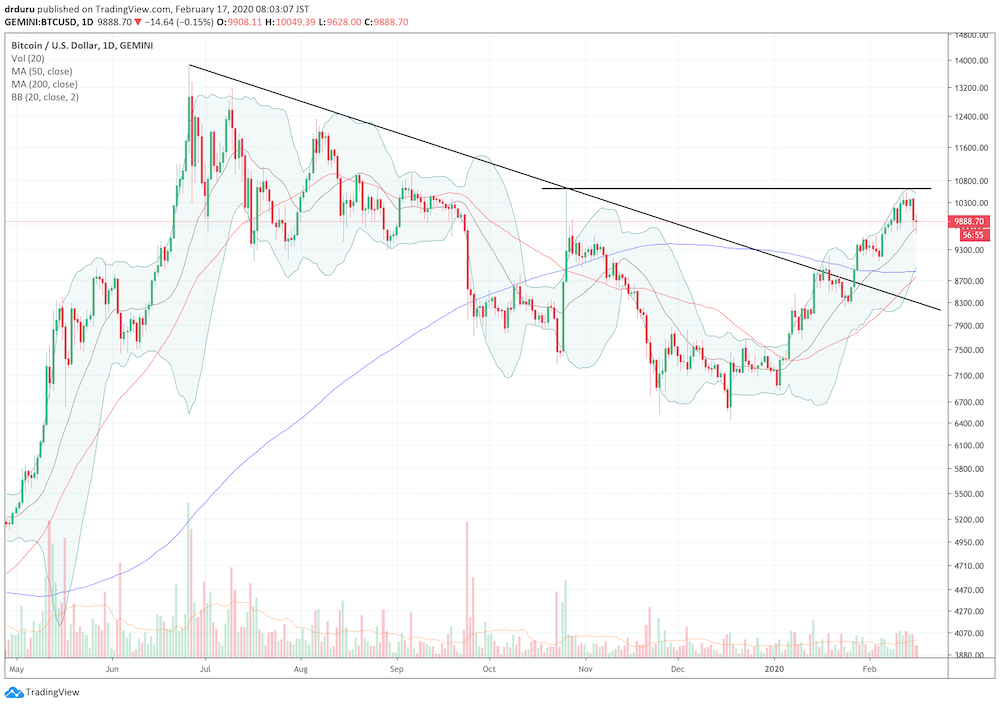
Source: TradingView.com
The Explanations
Since the round number of $10K has psychological importance, explanations must of course accompany the rally. Last week on CNBC’s Fast Money, Brian Kelly dutifully offered three drivers:
- The Bitcoin “halving” coming in May
- Institutional money flows
- 9-10% address growth over the past 30 days
Institutional money flows are always an easy and ready explanation given institutions are constantly moving money into assets. Yet, I have never heard the withdrawal of institutional money used as a way to explain downtrends, especially not the one that dominated trading in the second half of 2019.
Address growth is an interesting potential driver, but, again, the relationship is difficult to make. Like institutional money flows, address growth is on-going in Bitcoin whether the price is going up or down. Extreme address growth was clearly associated with the bubble-like run-up to Bitcoin’s all-time high. The chart below posted by bitcoinist.com shows the persistent increase in addresses (red line). Note well that address growth never went negative in any time period.
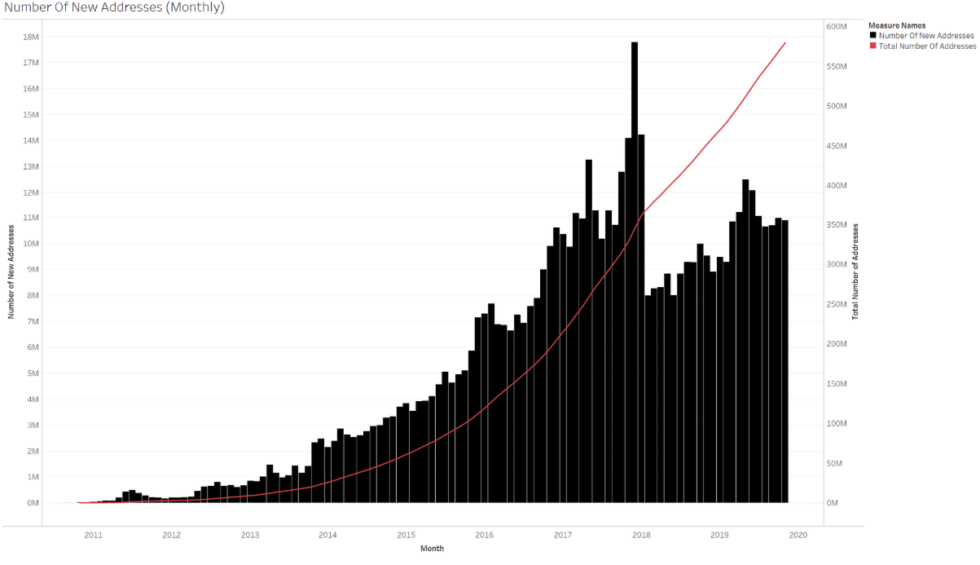
Source: Bitcoinist.com
The halving is the most interesting explanation to me – not because it is more convincing but because it contains explosive contradictions. The resolution of the contrary pricing forces should be quite telling for Bitcoin’s short-term trading direction.
Bitcoin has an automatic brake against inflation that cuts the rate of growth in Bitcoin in half every four years. The next halving is coming in May. Theoretically, this forced scarcity should drive up the price of Bitcoin given the same demand for the coins. However, Bitcoin costs a lot of money to mine. Tradeblock estimates the cost of mining a single bitcoin could soar from today’s profitable $6,851 to $12,000-15,000 after the halving.
The prospect of higher mining costs sets up the tension. Optimistic miners anticipating that higher costs will result in higher selling prices could build up inventory in anticipation of those higher prices. This kind of hoarding could cause scarcity in supply ahead of the halving and help to drive up price like now. However, if prices do not approach theoretical costs as the halving approaches, miners may feel compelled to sell to make sure they can continue to fund operations when profits go negative (negative profits could even force many miners into shutdowns). In such a case, Bitcoin could suffer a swift sell-off as lower prices motivate yet more selling. I find it telling that Bitcoin is not already trading at the halving’s theoretical mining cost. Either the cost model is wrong or this market is very inefficient (or some combination of both!).
2020 As the Year of Crypto
The parallel rally in alternative coins also belies point explanations for Bitcoin’s price rally in 2020. Just looking at the price action in alt-coins like Ethereum (ETH/USD), I would simply conclude that cryptocurrencies in general caught cachet again in 2020. (Note that Google Trend search interest in Ethereum pales in comparison to Bitcoin).
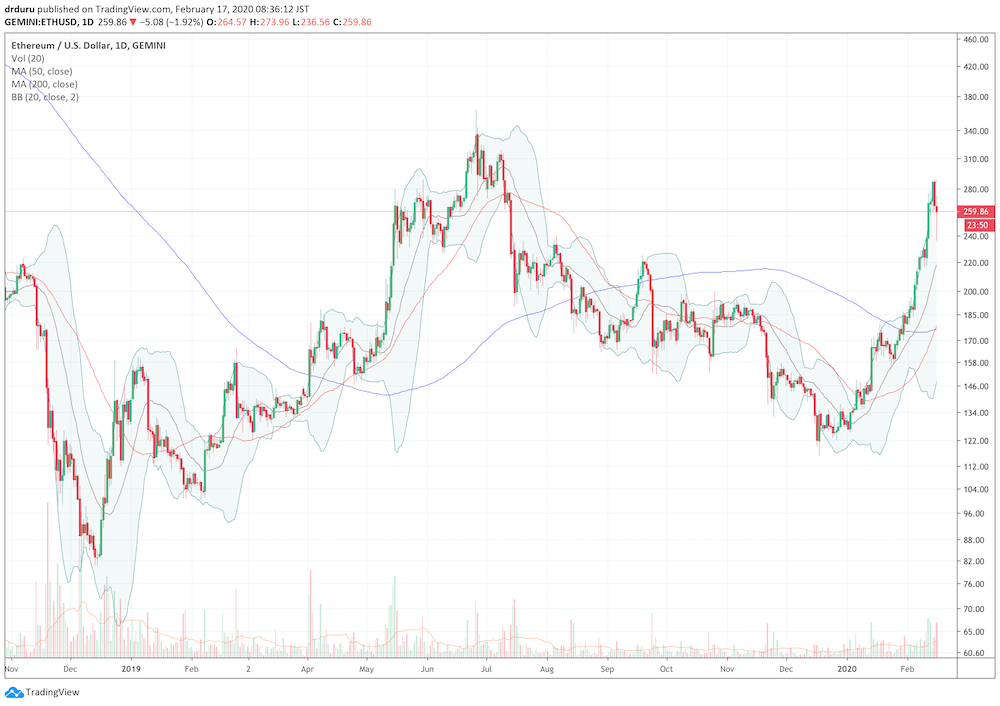
Source: TradingView.com
The Google Trend Momentum Check (GTMC)
I checked Google trends for clues. This time the Google Trends Momentum Check (GTMC) revealed little to nothing. While interest has slowly risen this year, there are no big moves to suggest that a rush into Bitcoin is underway. The good news is that this lack of apparent interest suggests plenty of upside remains for this rally. Recall that the big rally to the last major peak in June, 2019 was accompanied by a run-up in the GTMC. The GTMC flashed a red light and signal that the rally would not likely last much longer.
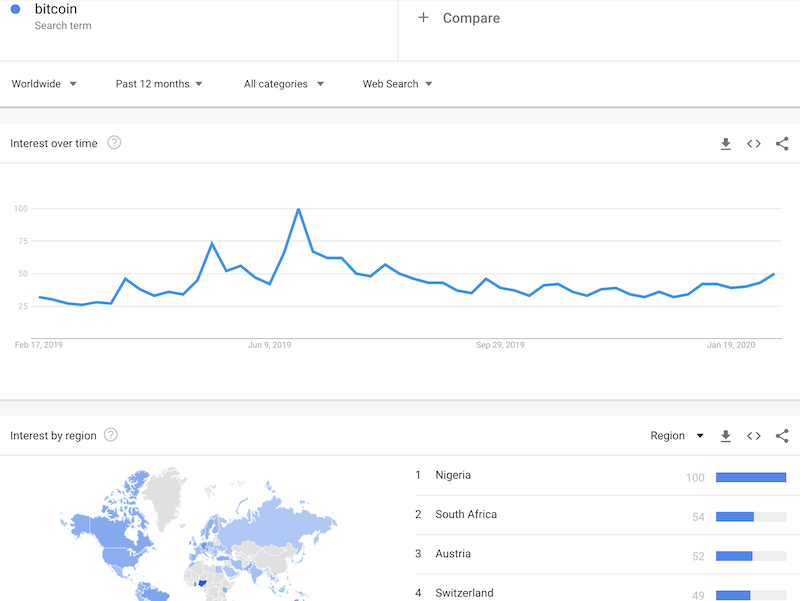
Source: Google Trends
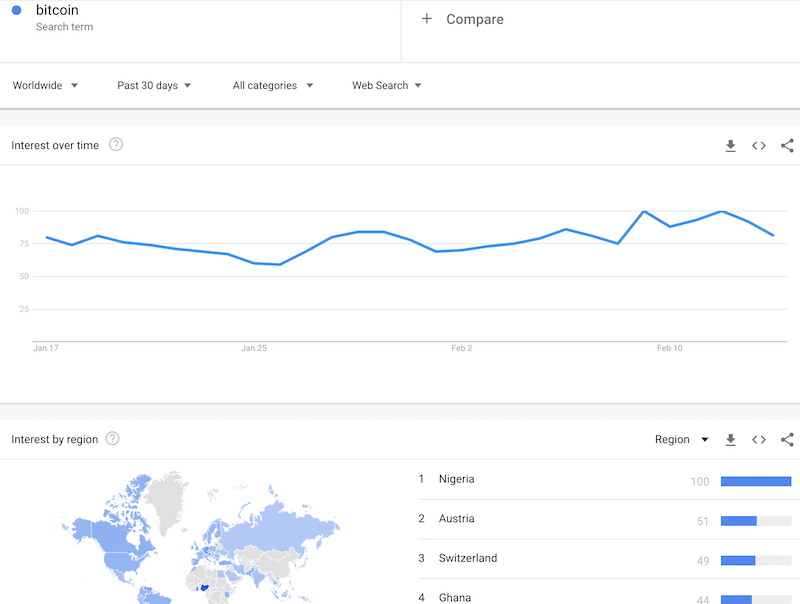
Source: Google Trends
South Africa has been a leading country for the GTMC for Bitcoin. It fell from number 2 to number 5 from the last 12 months to the last 30 days. Ghana popped up as number 4. The dominance of African nations in the GTMC for Bitcoin is a subtle sign of a future of cryptocurrency and economic innovation just over the horizon that could rival developments elsewhere in the world.
The Trade
I sold my Bitcoin holdings after watching the cryptocurrency struggle to break through the upper resistance line. After Bitcoin broke down below $10K on Saturday (February 15th), I immediately started a fresh accumulation process. I am assuming $8250 is the next level of firm support if selling pressure continues. That level represents the previous low converging with the former downtrend line. I will be happy to double down on Bitcoin at that level. A “worst case” scenario is a sell-off to last year’s lows where I would be even happier to buy more Bitcoin. I remain uninterested in speculating in alternative coins (which at the time of writing are experiencing steep sell-offs).
Be careful out there!
Full disclosure: long BTC/USD