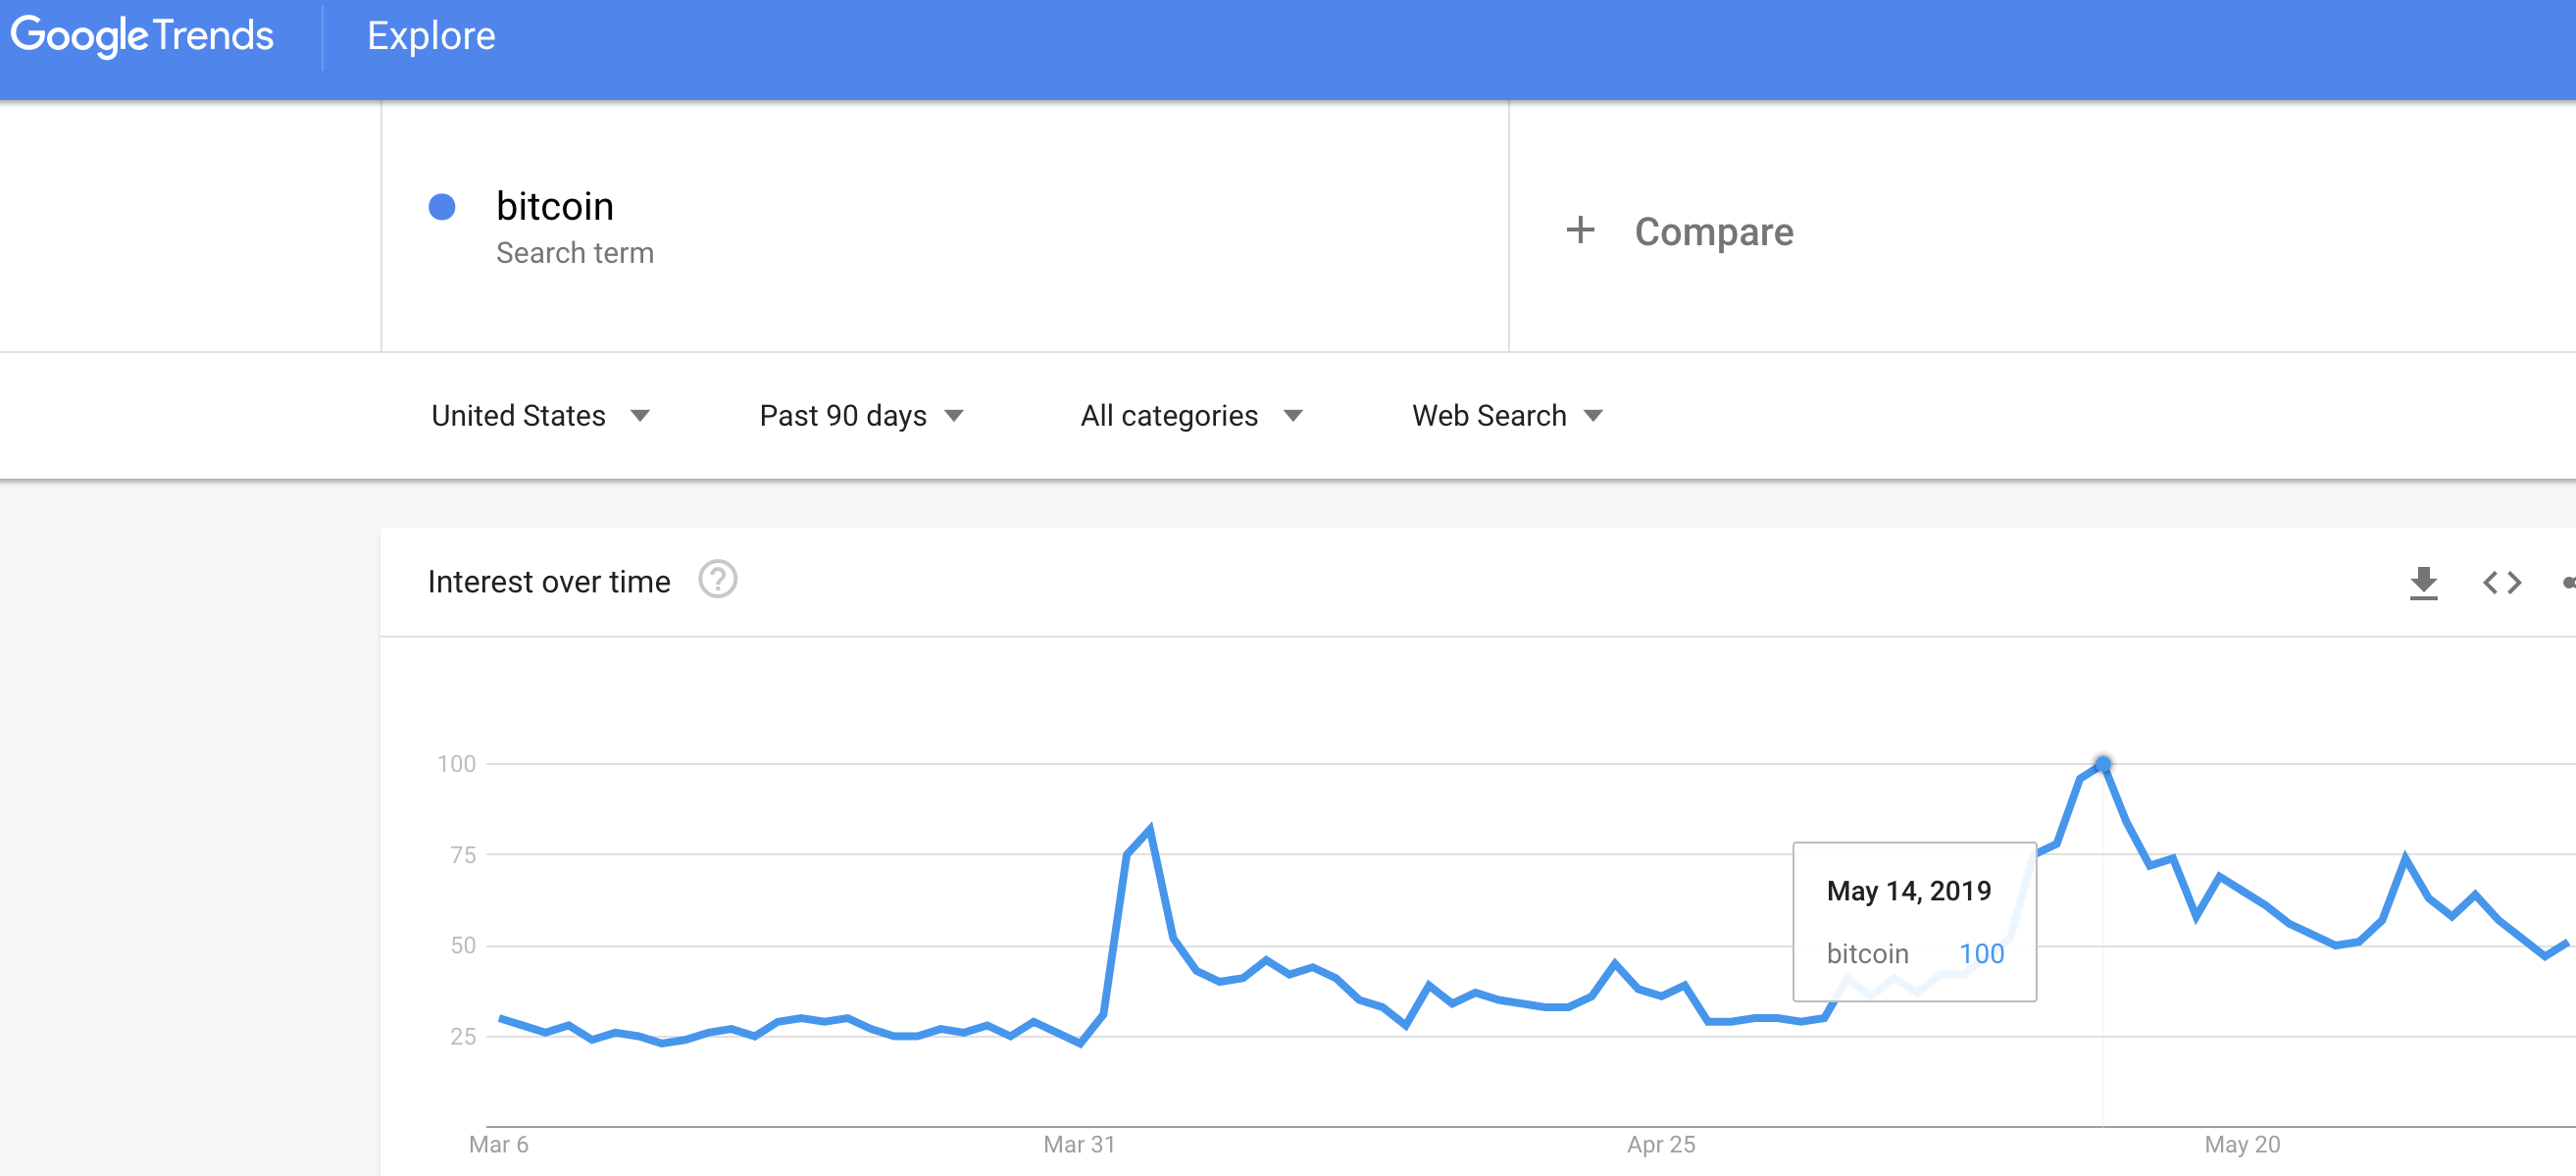
Google Trends continues to serve as a relatively good guide for identifying buy and sell points in Bitcoin (BTC-USD). As the latest example, I used Google Trends to decide to take profits into what looked like over-extended price action on May 13th. The next day, Google search interest peaked.

Source: Google Trends
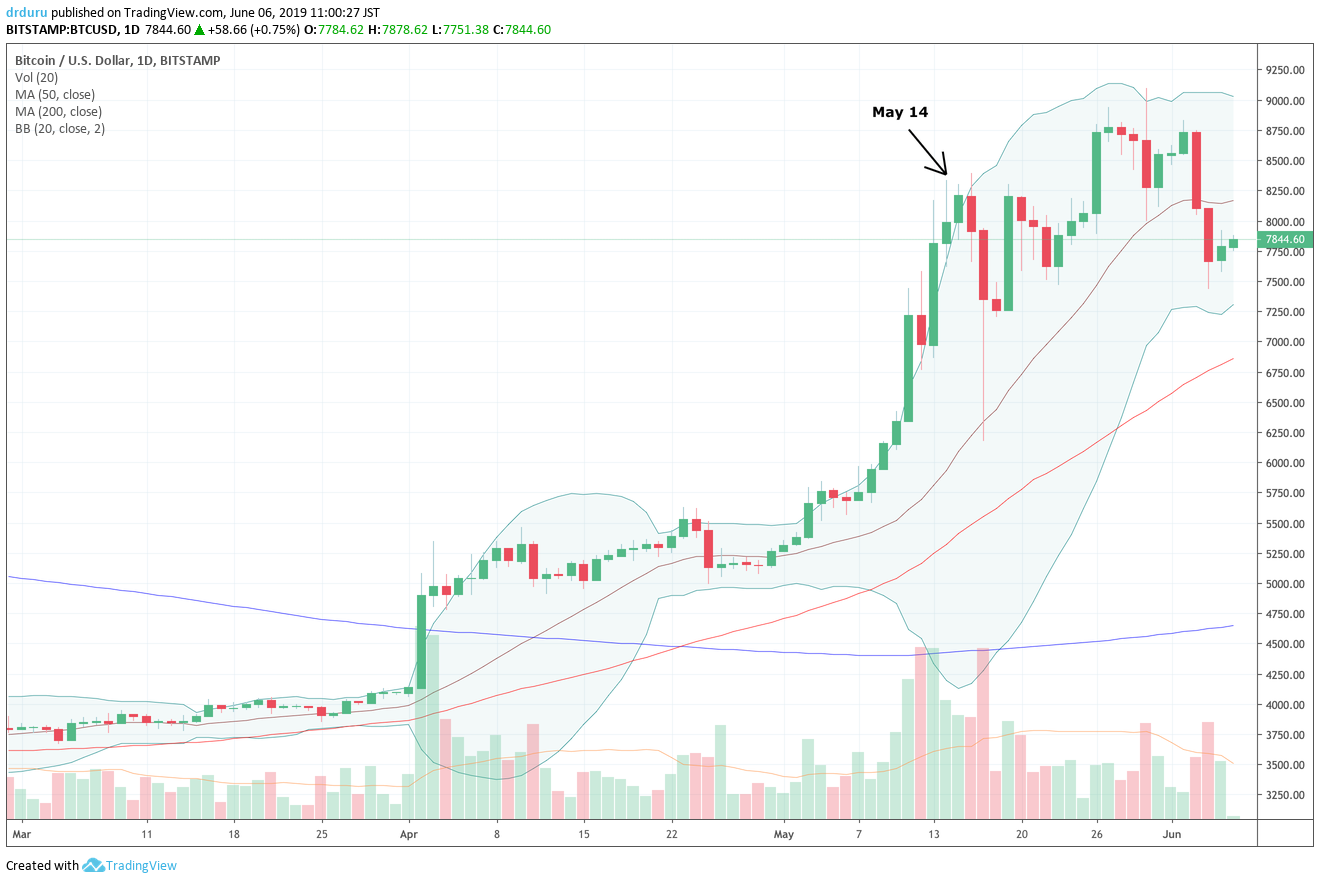
As a reminder, an extreme in search interest combined with an extreme in price typically signals a reversal in trend whether the trend at the time is up or down. I sold a bit early as it took another day for the price surge to end and Google search interest to peak. The day after that, Bitcoin suffered a “flash crash” where price suddenly plunged as low as $6178. That was enough of a price reversal for me to buy back into some Bitcoin, but I was not able to pull the trigger in time. The setup was particularly attractive because Bitcoin dropped quickly to the key 20-day moving average (DMA) uptrend.

Source: TradingView.com (Tokyo time zone)
While Bitcoin quickly recovered and even traded as high as $9096.76 on May 30th, the weight of the peak in search interest apparently still looms over the price action. At the time of writing, Bitcoin is weakly bouncing back from trading BELOW May 14th price levels. I assume that this drop indicates a topping process is underway. The technicals will confirm a top with a price break below the 50DMA. The topping pattern will get invalidated by price punching above the last intraday peak.
Despite this topping action, I stand by my conclusion that Bitcoin achieved a sustainable bottom based on April’s breakout paired with a jump in Google search interest and last November’s overdue reawakening in Google search interest.
Be careful out there!
Full disclosure: no positions
