
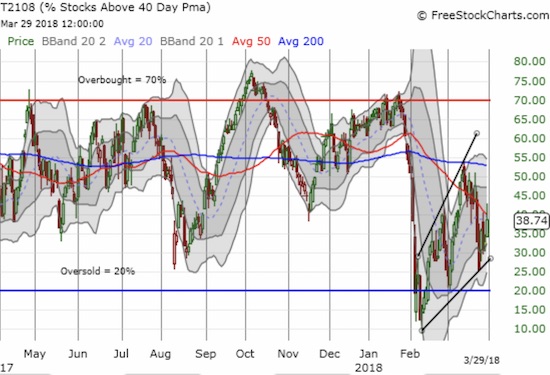
AT40 = 38.7% of stocks are trading above their respective 40-day moving averages (DMAs)
AT200 = 42.4% of stocks are trading above their respective 200DMAs
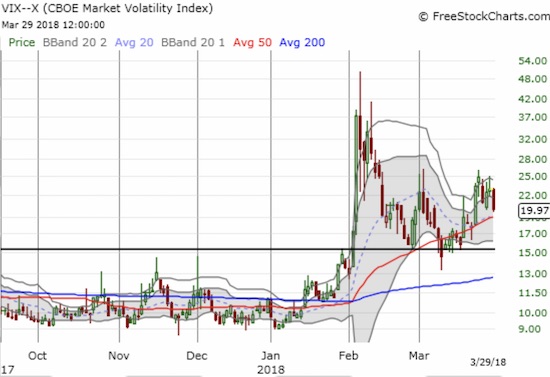
VIX = 20.0
Short-term Trading Call: neutral
Commentary
The bears did their best to spook the market, but they failed to break it down. The foundations felt wobbly for most of the week, but at the end of it all the major indices managed to record GAINS. The S&P 500 (SPY) ended the week up 2.0%. The NASDAQ and the PowerShares QQQ ETF (QQQ) each rebounded by 1.0%. The iShares Russell 2000 ETF (IWM) gained 1.2%. Even the materials sector, one area I fear HAS broken down, pushed the Materials Select Sector SPDR ETF (XLB) to a 1.6% gain for the week.
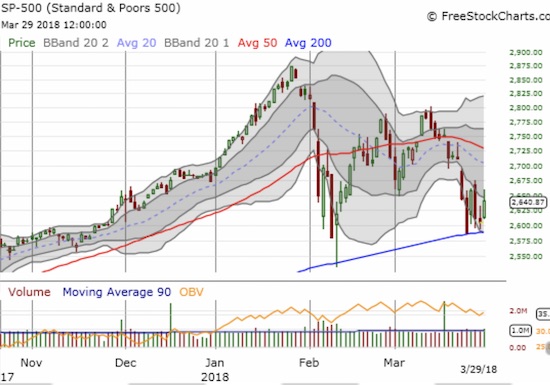
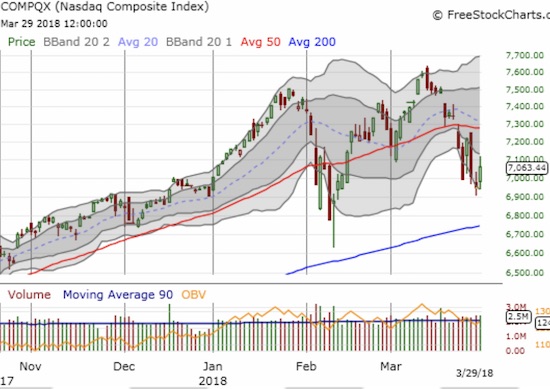
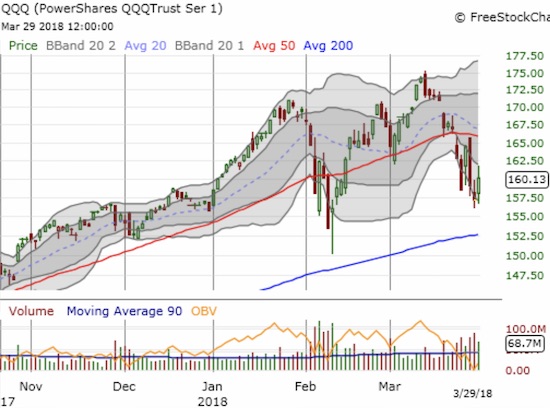
Although sellers pulled off a decent fade off the highs on Thursday, bulls and buyers should be encouraged by the ability of the S&P 500 (SPY) to stand its ground at its 200DMA. The NASDAQ and QQQ on the other hand did not defend any natural support. Indeed, Thursday’s rally was off a new low for the month. Tech stocks still have a lot to prove and still have the potential to drag the rest of the market down with them. For example, here is the positioning of the “usual suspects”:
- Amazon (AMZN): more government-driven gyrations as Trump’s attacks gapped AMZN below its 50DMA. Stock rallied from a 6-week intraday low to finish the day with a 1.1% gain that closed the stock at its lower-Bollinger Band (BB). AMZN is broken until proven innocent.
- Apple (AAPL): faded from 50DMA resistance and clung to a 0.8% gain on the day. The 200DMA is slowly converging from below.
- Facebook (FB): Somehow managed to end the week flat! Stock is still stuck in a steep downtrend defined by its lower-BBs and trades well below its 50 and 200DMAs.
- Google (GOOG): Likely in sympathy with Facebook’s data privacy issues, GOOG cracked 200DMA support. On Thursday, the stock gapped up above its 200DMA and finished with a 2.7% gain.
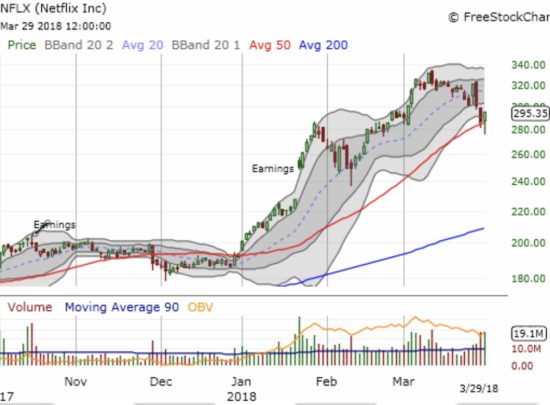
- Netflix (NFLX): Buyers twice had to pick NFLX off intraday lows that cracked 50DMA support. While the stock lost 1.9% for the week, at least it held 50DMA support.
- Nvidia (NVDA): Suspension of testing on driverless cars drove the stock below 50DMA. NVDA ended the week with a small loss.
Of this crew, NFLX is the most hopeful given it finished the week above critical support. Google (GOOG) is the most hopeful for a continued bounce given it gapped up above its 200DMA. I am most interested in buying the dip in NVDA given nothing has changed with its business model or prospects. However, the stock still looks like it has topped out for a good long while. Given the outpouring of love these stocks have enjoyed for so long, poor trading action in this group will tend to hurt sentiment.
The volatility index, the VIX, gyrated with the market. The VIX closed at a 1-week low in a pattern that looks like it has topped out around 25 for this cycle. This top coincides with the intraday top from the last fear cycle. I hope to take profits on my latest short iPath S&P 500 VIX ST Futures ETN (VXX) ahead of Friday’s jobs report. The timing will be tight as I expect volatility to tend upward in at least the day or two going into that report.
AT40 (T2108), the percentage of stocks trading above their respective 40DMAs, trended higher this week and maintained a pattern of higher lows and higher highs off the February swoon. This pattern is perhaps the most encouraging sign for bulls and buyers as it means fewer and fewer stocks are succumbing to selling pressures with each downward swoon. This view is quite a contrast with the general weakening in the usual tech suspects.
My short-term trading call stays at neutral of course. I wanted a washout into oversold territory to push me back into the bullish camp. Instead, it looks like a lot more churn ahead.
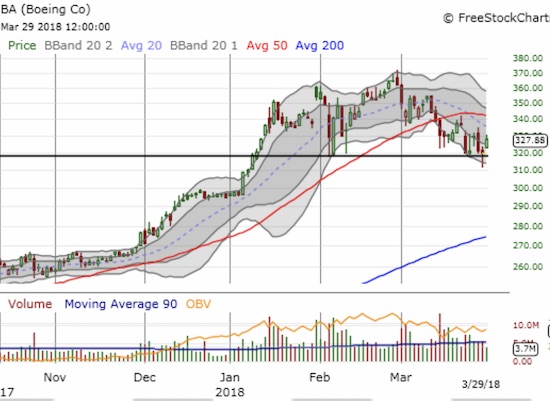
Dealing with that churn this week was a true pain. I feel fortunate that the week-ending rally enabled me to close out my SPY calls at a profit. I sold quickly after learning my lesson from sitting on these calls through Monday’s monster rally and then watching those profits disappear the next day. I wanted to hold these calls into the coming week, but the current churn does not support such holding. Similarly, on the bearish side, I quickly dumped more puts and shorts into Wednesday’s selling. In particular, I was able to profit from my Boeing (BA) put. BA ended up rallying sharply enough to create a hammer-like bottom. Now it will take a break below $312 to re-establish a bearish bias in this stock (see below).
CHART REVIEWS
Boeing (BA)
Netflix (NFLX)
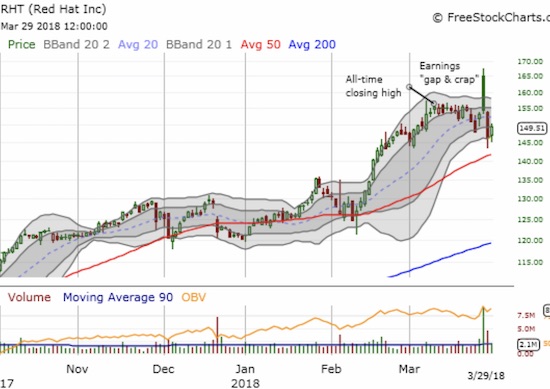
Redhat (RHT)
I have paid RHT little attention since the dust settled on the bursting of the tech bubble. Yet, here it is: RHT in March finally traded above its tech bubble highs from 2000. RHT now gets to enjoy a special spotlight. The momentum crowd is surely attracted to RHT for the all-time highs. However, the post-earnings gap and crap at these highs suggests a blow-off top is in. If buyers manage to defend 50DMA support, and, even better, push RHT to fresh all-time highs, I will assume market sentiment is even closer to healing…
Other trades related to previous posts: sold QQQ calls at a loss, decided against playing weekly AAPL calls given the holiday weekend
— – —
FOLLOW Dr. Duru’s commentary on financial markets via email, StockTwits, Twitter, and even Instagram!
“Above the 40” uses the percentage of stocks trading above their respective 40-day moving averages (DMAs) to assess the technical health of the stock market and to identify extremes in market sentiment that are likely to reverse. Abbreviated as AT40, Above the 40 is an alternative label for “T2108” which was created by Worden. Learn more about T2108 on my T2108 Resource Page. AT200, or T2107, measures the percentage of stocks trading above their respective 200DMAs.
Active AT40 (T2108) periods: Day #30 over 20%, Day #4 over 30% (overperiod), Day #6 under 40% (underperiod), Day #13 under 50%, Day #38 under 60%, Day #44 under 70%
Daily AT40 (T2108)
")
Black line: AT40 (T2108) (% measured on the right)
Red line: Overbought threshold (70%); Blue line: Oversold threshold (20%)
Weekly AT40 (T2108)

*All charts created using freestockcharts.com unless otherwise stated
The charts above are my LATEST updates independent of the date of this given AT40 post. For my latest AT40 post click here.
Related links:
The AT40 (T2108) Resource Page
You can follow real-time T2108 commentary on twitter using the #T2108 or #AT40 hashtags. T2108-related trades and other trades are occasionally posted on twitter using the #120trade hashtag.
Be careful out there!
Additional disclosure: long SPY shares, short VXX
*Charting notes: FreeStockCharts.com uses midnight U.S. Eastern time as the close for currencies. Stock prices are not adjusted for dividends.