
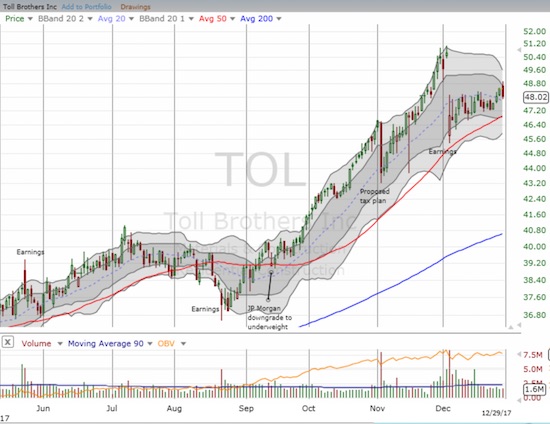
The last Housing Market Review covered data reported in November, 2017 for October, 2017. At the time, the iShares U.S. Home Construction ETF (ITB) traded at a 10+ year high with the angst of tax reform left far behind in the rear view mirror. The day after my post, Toll Brothers (TOL) reported earnings that disappointed the market. The sell-off was enough to knock ITB off its highs. ITB took almost the entire month of December to recover. TOL made a marginal new post-earnings high in the past week, but the overall effort to recoup losses looks lackluster. The good news is that support at the uptrending 50-day moving average (DMA) is holding firm.
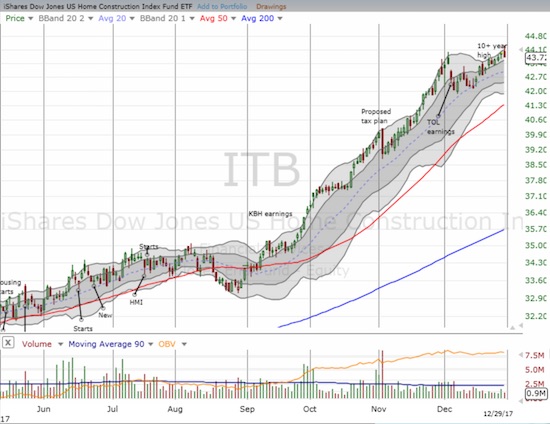
Source: FreeStockCharts.com
With bargains hard to find in the housing sector, I went ahead and nibbled on TOL by purchasing a few long-dated call options. The seasonally strong period for home builders began in November, so the risks shifted firmly in favor of the upside. My position in TOL is a “no regret” position: small enough to cause little pain if the trade fails and large enough to make a dent if the rally continues apace from here.
As the chart of ITB suggests, trading in most home builders was nondescript in December. There were three notable exceptions: Hovnanian (HOV), Meritage Homes (MTH), and LGI Homes (LGIH).
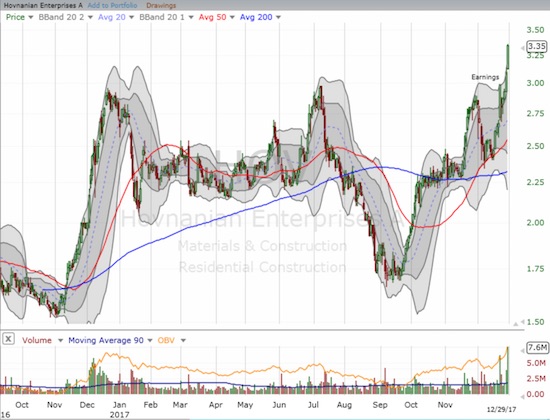
I rarely track Hovnanian (HOV) given the stock is in single-digits and the business has yet to demonstrate much of a post-recession recovery. However, the stock caught my attention in December and motivated me to review the overall stock chart. HOV bounced sharply from the financial crisis only to peak a little over a year later. In early 2016, HOV retested the 2011 low. HOV was on its way to a loss for the year until buyers suddenly surged into the stock in the second half of December. The move was a picture-perfect bounce off 50DMA support. This trading suggests to me that HOV got caught up in some of the manic moves often seen in single-digits stocks in holiday trading. Yet, the rally continued through earnings (with a slight hiccup). HOV gained 38% in the two weeks since it last tested 50DMA support. That is a move I cannot ignore.
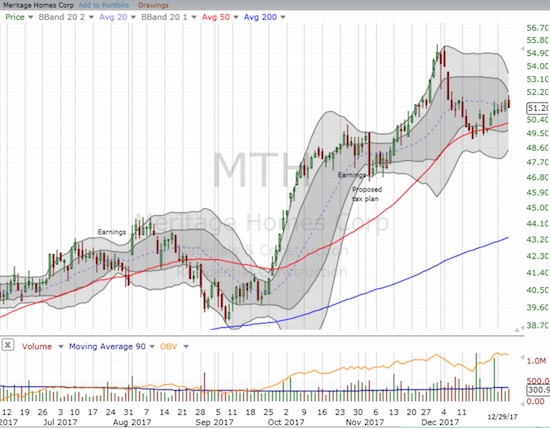
Meritage Homes (MTH) has been at the top of my list for months, but I never got the entry point I wanted. MTH was one of the home builders that soared after the initial angst over the tax plan. The stock almost went parabolic at the end of November on no news that I could find. The cool-off period featured a near picture-perfect retest of 50DMA support. Given this may be as good as it gets for a dip for a while, I am positioning to start nibbling on MTH in January.
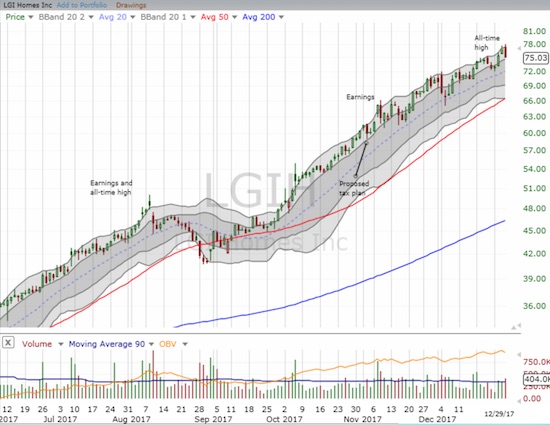
Finally, LGI Homes (LGIH) is the home builder stock that does not know how to quit. This regional builder with a heavy concentration of business in Texas has hit numerous all-time highs in the second half of the year. I doubt I can get comfortable at these levels buying back into the stock, but I do like using LGIH as an indicator of the underlying strength of the housing market rally. In particular, LGIH is “burdened” by a short interest that is a massive 38.9% of the float. Skepticism clearly looms large over LGIH, but the momentum keeps shoving that skepticism to the sidelines.
I was honestly astonished at the synchronized strength in the housing numbers for November. Housing activity picked up in a big way and with it sentiment and confidence. This kind of momentum could be sustainable if wage gains make significant progress in 2018; but that is a big IF. Moreover, consumer and builder sentiment is already at lofty levels. I will be looking closely for what catalysts emerge to continue supporting this robust pace of housing market activity.
New Residential Construction (Housing Starts) – November, 2017
Single-family housing starts for October were revised upward from 877,000 to 883,000. November starts increased month-over-month by 5.3% to 930,000. On an annual basis, single-family housing starts jumped 13.0%, representing a quick turn-around from October’s minimal gain.
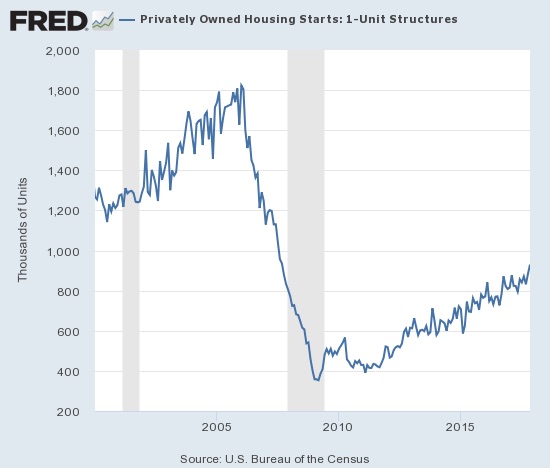
Source: US. Bureau of the Census, Privately Owned Housing Starts: 1-Unit Structures [HOUST1F], retrieved from FRED, Federal Reserve Bank of St. Louis, December 19, 2017.
After three months of non-dispersed regional changes, dispersion returned for September, October, and now November. The Northeast, Midwest, South, and West each changed 6.8%, -9.9%, 16.5%, and 24.4% respectively in November. The West delivered very strong growth again and provided fresh affirmation of the acute need for more housing in the West’s supply-constrained markets. The South is back in full throttle after a quick post hurricane recovery.
Existing Home Sales – November, 2017
The routine description for existing sales is usually sales decline because of a shortage of inventory and sales increase in spite of inventory shortages. For October, 2017, the National Association of Realtors® (NAR) delivered a slight twist by applauding another small monthly increase in sales but complained that lack of inventory caused a year-over-year decline in sales. For November, the NAR delivered another twist by distinguishing between the upper-end and the rest of the market to help explain how sales can surge despite the parallel relentless increase in prices.
“Faster economic growth in recent quarters, the booming stock market and continuous job gains are fueling substantial demand for buying a home as 2017 comes to an end…The odds of closing on a home are much better at the upper end of the market, where inventory conditions continue to be markedly better…Price appreciation is too fast in a lot of markets right now…
The healthy labor market and higher wage gains are expected to further strengthen buyer demand from young adults next year. Their prospects for becoming homeowners will only improve if more lower-priced and smaller-sized homes come onto the market.”
For January 2017, existing home sales rose to levels not seen since February, 2007. In February 2017, existing home sales dropped sharply and then rebounded sharply in March to a new post-recession high. Sales declined through the summer and convinced me that the top was in for the year. November proved me wrong with existing home sales climbing to a new 11-year high.
The seasonally adjusted annualized sales of 5.81M were up 5.6% month-over-month from 5.50M in sales for September (revised up from 5.48M). Year-over-year sales increased 3.8% which definitively broke a recent pattern of deceleration since April: November 15.4%, December 0.7%, January 3.8%, February 5.4%, March 5.9%, April 1.6%, May 2.7%, June 0.7%, July 2.1%, August 0.2%, September -1.5%, October -0.9%. Suddenly the prospects for the Spring selling season look a lot better than before. However, I will also be looking to see whether marginal buyers are pulling sales into this year to qualify for the grandfathering of tax benefits that will cease to exist for buyers after this year.
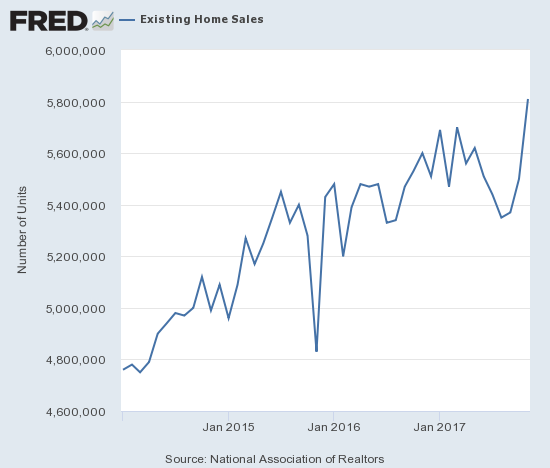
(recall that the NAR no longer makes data available before 2013. For more historical data to 1999 click here)
Source: National Association of Realtors, Existing Home Sales© [EXHOSLUSM495S], retrieved from FRED, Federal Reserve Bank of St. Louis, December 25, 2017.
The share of sales going to first-time buyers decreased from 32% to 29%. This share was also 32% a year ago, but it is the same as September’s 29%. September was the first time in two years where the share dropped below 30%. Yet, the NAR chose THIS month’s decline as an opportunity to suggest that the drop may be a sign that investors are crowding out first-time homebuyers.
“As evidenced by a subdued level of first-time buyers and increased share of cash buyers, move-up buyers with considerable down payments and those with cash made up a bulk of the sales activity last month…
The elevated presence of investors paying in cash continues to add a layer of frustration to the supply and affordability headwinds aspiring first-time buyers are experiencing.”
The average share for first-time homebuyers for 2016 was 35% and the NAR’s 2017 Profile of Home Buyers and Sellers reported an average of 34% for 2017. Investors purchased 14% of homes in November which is within the recent range, so I do not yet share the NAR’s apparent alarm.
The absolute level of inventory of existing homes fell year-over-year for the 30th straight month. During November’s press conference, the NAR noted that October set a record low absolute and relative inventory level across all Octobers since data collection started in 1999. Recall that during the June press conference, the NAR talked about a housing crisis in supply in some housing markets. For this latest report, the NAR made a distinction between the relative availability in higher-end markets and the inventory constraints in the rest of the market. So the NAR’s fears about declining affordability must be focused below the upper tier of the market.
“The anticipated rise in mortgage rates next year could further cut into affordability if these staggeringly low supply levels persist…Price appreciation is too fast in a lot of markets right now. The increase in homebuilder optimism must translate to significantly more new construction in 2018 to help ease these acute inventory shortages.”
The 1.67M homes for sale represented a 9.7% decrease from the previous November and a 7.2% decrease from October’s already low 1.80M. The string of year-over-year declines is remarkable: for example, starting from 2016…August -10.1%, September -6.8%, October -4.3%, November -9.3%, December -6.3%, January -7.1%, February -6.4%, March -6.6%, April -9.0%, May -8.4%, June -7.1%, July -9.0, August -6.5%, September -6.4%, and October -10.2%. These are the declines of an increasingly dysfunctional market that, as the NAR continues to imply, is driving prices to levels that will be hard to sustain without a dramatic improvement in the financial standing of potential home buyers.
In December, 2016, inventory hit 3.6 months of sales and a new absolute low measured from 1999 when the NAR began tracking. Inventory plunged from October’s 3.9 months of sales to November’s 3.4 months. In the press conference, the NAR indicated it expects a further decline in December. September’s inventory was 4.2 months of sales. A year ago inventory sat at 4.0 months. So the current decline is beyond seasonal expectations and represents a relatively rapid disappearance of homes for sale even with the on-going downtrend. In the press conference, the NAR noted that current conditions have created winners out of homeowners but losers out of first-time home buyers; the on-going price gains that are far outpacing wage gains are bad for the long-term health of the housing market.
For November, the regional areas experienced flat to strong sales gains: Northeast 0.0%, Midwest 6.8%, South 4.0%, West 2.5%. All regions logged substantial year-over-year jumps in their median price: Northeast 4.0%, Midwest 8.8%, South 4.8%, West 8.2%.
November’s 5.8% year-over-year increase in the overall median price of an existing home amazingly represents the 69th consecutive month of year-over-year increases. The median price of $248,000 is up slightly from October’s $247,000 and another step closer to returning to August’s record $253,500.
Single-family sales increased 4.5% on a monthly basis and increased on a yearly basis by 3.2%. The median price of $248,800 was up 5.4% year-over-year.
New Residential Sales – November, 2017
New single-family home sales declined in July steeply enough to threaten a break of the years-long uptrend. August’s hurricane-impacted sales numbers seemed to seal the fate of that uptrend. And then September happened: despite broad-based declines in existing home sales in September, new home sales soared on both a year-over-year and month-over-month basis. October delivered a repeat performance. November essentially confirmed a tremendous resurgence in new home sales that is now synchronized with the resurgence of existing home sales.
The Census Bureau revised October sales of new single-family homes significantly downward from 685,000 to 624,000 (a second consecutive month with a significant downward revision). New home sales for November increased 17.5% month-over-month and soared an incredible 26.6% year-over-year to 733,000. Even if the Census Bureau issues another large downward revision, these numbers solidly confirm the bull run in new home sales is still in full stride. Year-over-year gains have regularly hit double digits since 2012; November’s double-digit jump was the highest since February, 2015 when new home sales soared 29.8% year-over-year. New home sales hit a new post-recession high and have not been this high in over 11 years. Sales have FINALLY returned to 50% of the peak from the last housing bubble. Note well that year-to-date new home sales have increased 34% while they increased 37% during the entire 4-year period of consolidation for ITB (2013 to 2016).
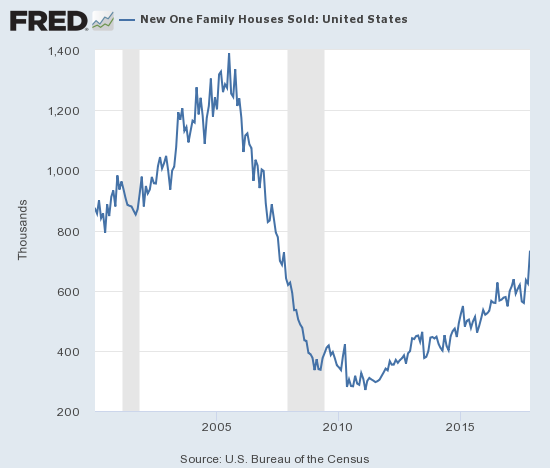
Source: US. Bureau of the Census, New One Family Houses Sold: United States [HSN1F], retrieved from FRED, Federal Reserve Bank of St. Louis, December 26, 2017.
In September, new home sales were strong enough to plunge inventory from 6.1 months of supply to 5.0 months. October’s inventory slipped slightly to 4.9 months of supply. The exceptionally strong sales volume of November pushed inventory to 4.6 months of supply. A market for homes is in balance at 6 months of supply, so the market has become increasingly unbalanced and creeping toward the same kind of supply crisis besetting existing homes. August’s relative inventory was the highest since October, 2011, so the current numbers represent a dramatic change in character. I wondered out loud about downward revisions for September and October. Given the tremendous rise in sales in November, I strongly suspect the Census Bureau will issue a significant downward revision again.
For October’s sales jump, I was surprised that the median price of a new home actually fell 3.3% from September (and I erroneously reported a year-over-year decline as well). The Census Bureau made a significant upward revision in the median price from $312,800 to $319,600 – not only above September’s median but also the fifth highest price of the year. For November, the median fell slightly from October to November’s $318,700, a 1.2% year-over-year gain.
On a regional basis, new home sales returned to divergent behavior…and with a vengeance. The Northeast experienced its FOURTH month of sharply higher sales with a 53.3% year-over-year gain (compare to 65.2% for August, 54.8% for September, and 64.7% for October). The Midwest stayed flat at 0.0%. The South beat October’s post-Hurricane gains with a 32.5% year-over-year surge. The West popped 22.8% year-over-year.
Home Builder Confidence: The Housing Market Index– December, 2017
In March, builder confidence soared to a new 12-year high at 71. For the remainder of the year, the HMI hovered just under that 12-year high. November’s reading of 70 marked a near return to that 12-year high, and now December’s reading of 74 blasted the ceiling to send HMI to a level not seen since July, 1999. It was a close call, but my (revised) prediction of a new 12+ year high by year-end rang true. Sentiment was so strong that the NAHB avoided any of its boilerplate caution about rising cost pressures…
“Housing market conditions are improving partially because of new policies aimed at providing regulatory relief to the business community…
With low unemployment rates, favorable demographics and a tight supply of existing home inventory, we can expect continued upward movement of the single-family construction sector next year.”
The big push higher in sentiment came mostly from the traffic of prospective buyers. This HMI component soared from 50 to 58. Since 2004, the traffic of prospective buyers has spent very little time above 50. Home buyers (shoppers) must be extremely bullish right now even with consumer sentiment cooling off a bit the past few months.
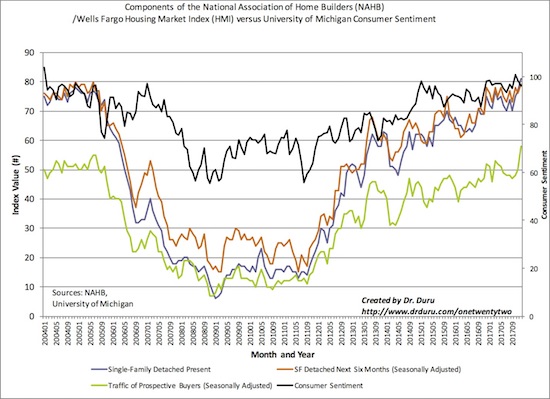
Source: NAHB
For May and June, there was an interesting disparity in the regional changes in HMI. In May, the West finally broke out from the flatline of the previous 4 months with an 80 reading. The West plunged in June back to 71 to a near 1-year low and since then has climbed higher. The West hit 77 for November and soared to 85 for December. This level is still not a multi-year high as the West hit 86 last December. In 3 of the last 4 years, the West regional HMI has soared from November, so I am guessing January will deliver a drop large enough to impact overall HMI. (The NAHB may need to tweak its seasonal adjustments?). The Northeast surged “out of nowhere” to 63 in November from October’s 49 and plunged back to 53 for December which was the previous 2017 high set in March. The South moved up to a new high for the year and new 13-year high at 75. The Midwest moved out of its laggard status to jump from November’s 65 to December’s 76 reading. This level surpassed the previous high for the year of 72 set in March and is by far the highest reading for the Midwest since at least December, 2004.
Parting thoughts
Housing data and housing stocks are very close in alignment with notable uptrends in place and confirmed for both. The seasonally strong period for housing stocks is on strong footing so far. It is very telling that two housing stocks were part of the top 20 performers in the S&P 500 (SPY) for 2017: D.R. Horton (DHI) ranked #9 with an 86.8% gain for the year and PulteGroup (PHM) ranked #12 with an 80.9% gain for 2017.
Yet, the relentless march higher in the price of homes looms as the biggest threat to the health and balance of the market. These out-sized price gains are on a slow collision course with higher mortgage rates. Adjustments in the tax incentives for housing will not help and could further exacerbate the issue (Toll Brothers insists that high-end customers do not care about the tax implications of home buying). For these reasons, I will not be as aggressive as usual in buying the dips as I normally would during this season. I will likely stay content with the current small portfolio and trade call options in ITB as the primary way to buy into any dips.
California, particularly the San Francisco Bay Area, may be one of the most important housing markets to watch this season. All the negatives of the housing recovery are converging there. A true housing crisis is in full swing with limited supply causing severe imbalances. In September, Governor Jerry Brown signed 15 housing bills in a desperate attempt to address affordability problems throughout the state. Brown acknowledged that even this set of bills is just the beginning of the legislative effort. The latest report from CoreLogic on the Bay Area’s housing market provides a stark look into these imbalances for November. As reported by the Mercury News:
“Just when it seemed Bay Area home prices couldn’t jump any higher, they soared to dizzying new heights in November — and in the process, set a new record.
The median price for a single-family home in the Bay Area last month was $825,000, up nearly 15 percent from the same time last year, according to new data from property analytics company CoreLogic.
That’s the most expensive since CoreLogic started keeping track in 1988, surpassing the last record of $823,000 set in June.”
The dearth of sales activity is simply startling:
“Just 723 new homes were sold in the region last month, compared to 5,123 older homes, which make up the bulk of the market. And the number of new homes sold dropped more than 14 percent from last year. In San Francisco, just 13 new homes sold last month, compared to 128 in November of last year.”
Note that the Bay Area’s population is almost 8 million.
Be careful out there!
Full disclosure: long TOL call options