
AT40 = 25.4% of stocks are trading above their respective 40-day moving averages (DMAs)
AT200 = 43.9% of stocks are trading above their respective 200DMAs
VIX = 19.9%
Short-term Trading Call: neutral (caveats below!)
Commentary
As I feared was likely, the S&P 500 (SPY) wasted no time in breaking its 50-day moving average (DMA) support.
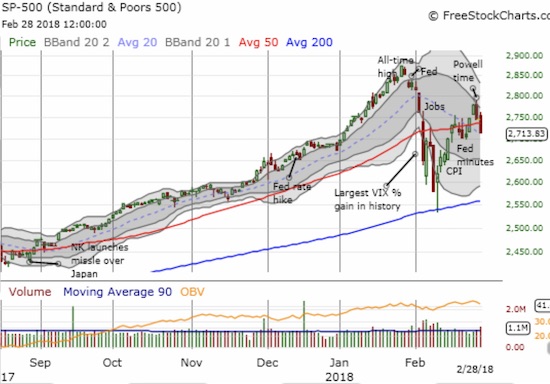
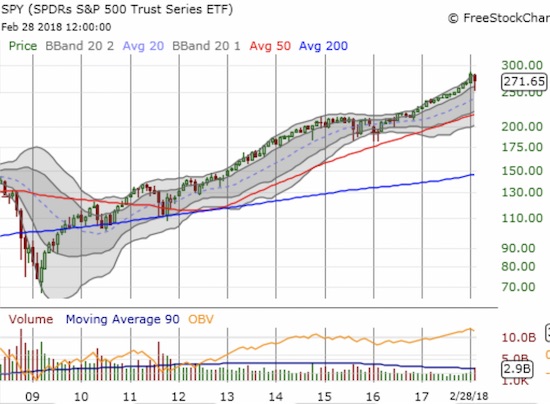
The S&P 500 lost 2.2% for the month. This February was only the second negative February after 2009. The only other loss was a marginal 0.4% two years ago. Moreover the index last experienced a monthly loss in March, 2016! The monthly chart of SPY below shows the smooth (monthly) sailing for almost two years.
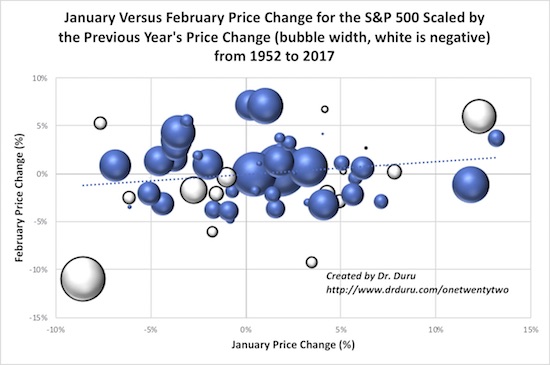
While February’s selling may seem and look like an anomaly, a longer historic view reminds me that this performance was not an anomaly. Below is a chart of a given year’s January price change versus its February price change on the S&P 500. The size of the bubble indicates the magnitude of the annual price change of the previous year. White bubbles are negative years. The dashed line is a trendline for the monthly price changes. January’s price change was positive 5.6%.
The tech-laden indices, the NADSAQ and the PowerShares QQQ ETF (QQQ), fared a little better that the S&P 500 with losses of 0.8% and 0.6% respectively. Both indices remain well above tests of their 50DMAs.
The volatility index continued its bounce off the 15.35 pivot with a gain of 6.8% and a close at 19.9. The VIX is right back in “elevated” territory (20 and above). With the S&P 500 cracking the 50DMA barrier, I switched my volatility trade strategy by speculating on call options on ProShares Ultra VIX Short-Term Futures (UVXY). I set a target for a 50% gain, and, much to my surprise, my limit order filled in less than an hour. The bumrush of selling into the market close swept volatility higher. I am still holding my short iPath S&P 500 VIX ST Futures ETN (VXX) as the longer-term positioning.
The breaking of the 50DMA barrier also forced me to switch my trading call from bullish back to neutral. I hate the chop in the short-term trading call, but the changes reflect the rapid dynamics in the market. As I noted in my last Above the 40 post, if AT40 (T2108) were not so close to oversold, I would be outright bearish right now. My first target would be to short QQQ down to 50DMA support, and I still might do it as a hedge for other long positions.
AT40 (T2108), the percentage of stocks trading above their respective 40DMAs, cratered from 31.2% to 25.4%. My favorite technical indicator is essentially just one day of selling away to returning to oversold conditions for the third time in a month. I assume the switch will flip just as the NASDAQ and QQQ are testing their 50DMAs. I will be on edge at that point bracing for a fresh spike in volatility (and hopefully well-positioned with new UVXY call options ahead of the move!).
Still, one step at a time. New Federal Reserve chair Jerome Powell has a second day of testimony in front of Congress on Thursday; the responses during Q&A are an important wildcard.
Next up is to see whether sellers really have retaken control of the market by showing follow-through on the S&P 500’s 50DMA breakdown.
CHART REVIEWS
U.S. Dollar Index (USD)
Another important test of a 50DMA is happening, but this one is a test of resistance. The U.S. dollar index has fought its way back from what now looks like a double-bottom (the close inverse of EUR/USD that I showed in the last post). While the dollar is a symptom of other forces, like higher interest rates, I think it is a looming reminder to the market that the previous weak-dollar theses and trades are teetering all over again. As we saw in the last sell-off, forced changes in trading strategies can generate extra volatility. So, once again, I am bracing myself.
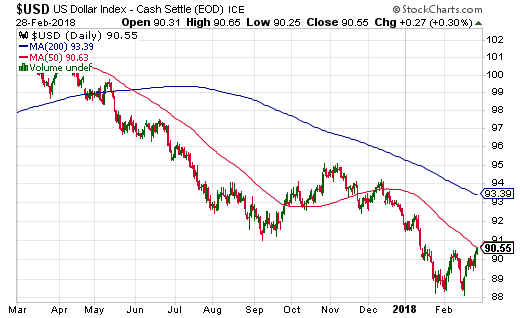
Source: StockCharts.com
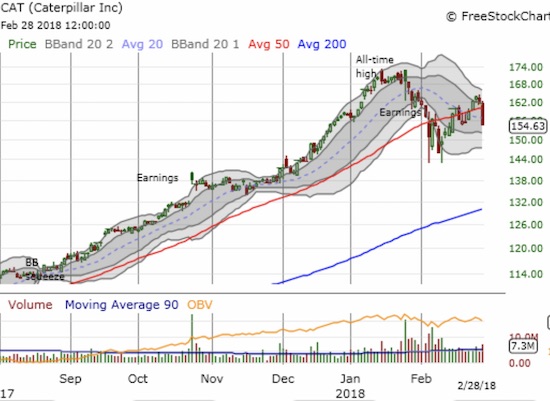
Caterpillar (CAT)
Industrial, cyclical stocks like Caterpillar are particularly vulnerable to a strengthening dollar. CAT took a big hit with a 4.1% loss as it smashed through 50DMA support. I tried to add to my existing CAT put position once support crumbled, but I did not get the price I wanted. I will be looking to lock in profits on my hedge as my put expires on Friday.
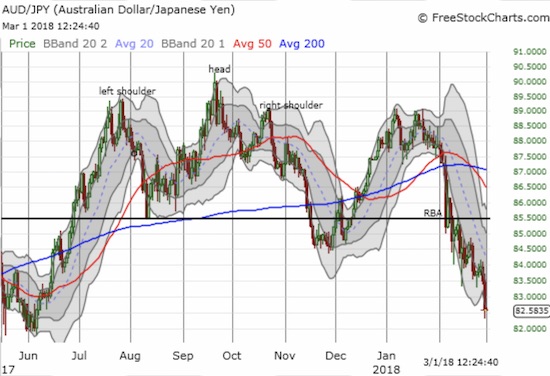
Australian dollar versus Japanese yen (AUD/JPY)
Needless to say, the plunge in AUD/JPY to a level unseen since June of last year confirmed for me the rapid increase in bearishness in financial markets. Rather than close out my existing short position, I expanded it. I am also focused on long yen trades across the board right now.
Trades related to previous posts: None
— – —
FOLLOW Dr. Duru’s commentary on financial markets via email, StockTwits, Twitter, and even Instagram!
“Above the 40” uses the percentage of stocks trading above their respective 40-day moving averages (DMAs) to assess the technical health of the stock market and to identify extremes in market sentiment that are likely to reverse. Abbreviated as AT40, Above the 40 is an alternative label for “T2108” which was created by Worden. Learn more about T2108 on my T2108 Resource Page. AT200, or T2107, measures the percentage of stocks trading above their respective 200DMAs.
Active AT40 (T2108) periods: Day #9 over 20% (overperiod), Day #1 under 30% (ending 3 days over 30%), Day #16 under 40%, Day #16 under 50%, Day #17 under 60%, Day #23 under 70%
Daily AT40 (T2108)
")
Black line: AT40 (T2108) (% measured on the right)
Red line: Overbought threshold (70%); Blue line: Oversold threshold (20%)
Weekly AT40 (T2108)

*All charts created using freestockcharts.com unless otherwise stated
The charts above are my LATEST updates independent of the date of this given AT40 post. For my latest AT40 post click here.
Related links:
The AT40 (T2108) Resource Page
You can follow real-time T2108 commentary on twitter using the #T2108 or #AT40 hashtags. T2108-related trades and other trades are occasionally posted on twitter using the #120trade hashtag.
Be careful out there!
Full disclosure: short VXX, long SPY call spread and SPY calls, long EUR/USD, long and short various currency pairs on the U.S. dollar, short AUD/JPY, long the Japanese yen, long CAT puts and calls
*Charting notes: FreeStockCharts.com uses midnight U.S. Eastern time as the close for currencies. Stock prices are not adjusted for dividends.