
AT40 = 32.8% of stocks are trading above their respective 40-day moving averages (DMAs)
AT200 = 49.5% of stocks are trading above their respective 200DMAs
VIX = 19.5
Short-term Trading Call: cautiously bullish (downgrade from bullish – see below for more details)
Commentary
The trading contours in the aftermath of an oversold episode can move quickly. Another important juncture arrived on Friday in the form of a potentially bearish pattern.
The bulls were fully in control again on Friday as the S&P 500 (SPY) looked like it was going to print an important confirmation of a breakout above its 50-day moving average (DMA). However, once headlines blazed with news about indictments of 13 Russian nationals over meddling in U.S. elections, the party came to an abrupt halt. The result was a fade sharp enough off the highs to create bearish signals across many stocks and even indices: the dreaded evening star. An evening star is a sign of potential reversal at the end of an uptrend that has exhausted buyers.
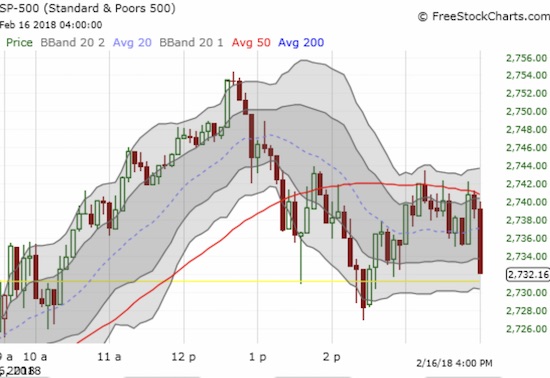
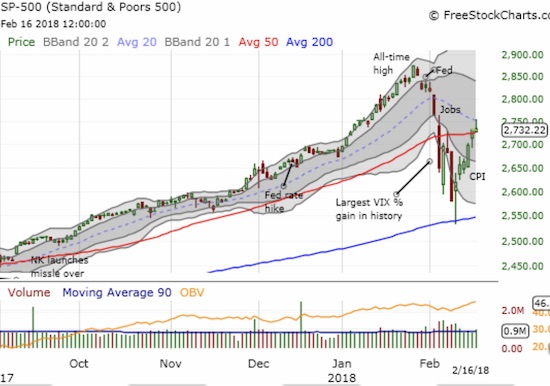
The bearish evening star pattern needs confirmation with a down day. A close above the intraday high invalidates the pattern. Given the precarious state of the oversold bounce, I decided to downgrade my short-term trading call to “cautiously bullish.” I will be even more aggressive on the bullish side if/when the bearish pattern gets invalidated. As a reminder, I switch to bearish if/when the S&P 500 breaks and closes below 2649. If AT40 (T2108), the percentage of stocks trading above their respective 40DMAs, drops into oversold conditions at the same time, I will have to keep the trading call at cautiously bullish but be prepared for a much more extended churn through the oversold period.
AT40 closed at 32.8%. My favorite technical indicator has not yet reached “escape velocity” from oversold territory (below 20%). An AT40 above 40% will add powerful confirmation to an invalidation of the evening star.
The volatility index, the VIX, notched its first gain, albeit minor, in over a week. The implosion of volatility will not be complete until it falls below the 15.35 pivot. Hanging around the current level of 20 keeps volatility in “elevated” territory. I am actively looking for the next opportunity to fade volatility. Perhaps starting around 25, the risk/reward for such a fade will get too good to pass up. The chart below shows how well past surges of volatility from 2010 to 2012 created well-defined brackets for this latest surge of volatility.
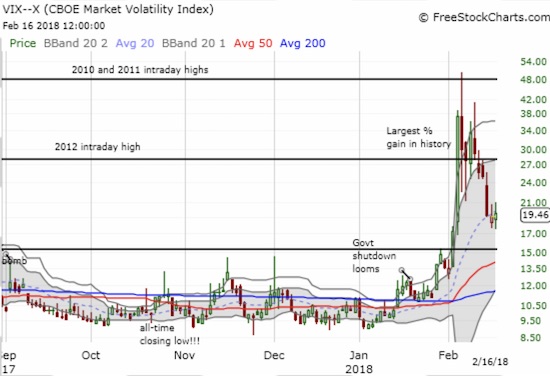
CHART REVIEWS
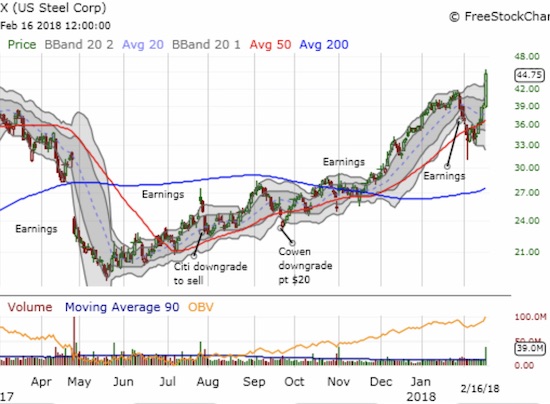
U.S. Steel (X)
To start last week, I pointed out another bullish pattern developing on X. I saw a breakout brewing but was prepared to accumulate shares down to about $33. I never got that chance. Instead, X confirmed the breakout the next day, and I failed to grab the call options at the price I wanted. The next day, I failed again, but bought shares just to make sure I did not miss a move if I never got my fill of call options.
This trade turned into one of those moments I look back and WISH I was aggressive from the start. On Friday, U.S. Steel soared 14.8% on the heels of yet more tariff news on imported steel and aluminum. X is now at a 3 1/2 year high. I will be putting a tight stop on this trade as I suspect the celebration over trade wars could end at any time.
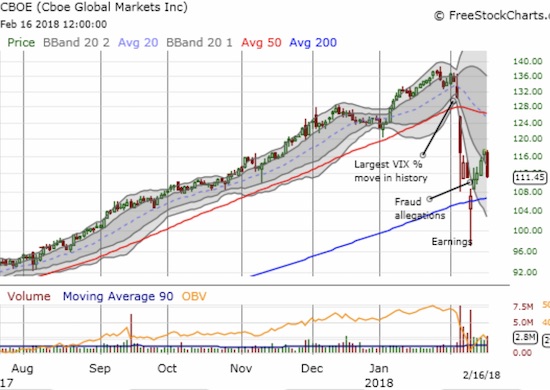
Cboe Global Markets, Inc. (CBOE)
My vigil over CBOE continues as I try to decide on an entry point to go long.
Last week started with serious allegations of VIX manipulation. CBOE vigorously denied the charge and defended the integrity of its product. The market ignored the noise and sent CBOE higher until the end of the week. Sellers stepped back in and sent CBOE to a 5.1% loss. The high volume suggests that CBOE’s bounce from a post-earnings sell-off is over. A close above $118 invalidates the latest bearish move, but I expect a retest of 200DMA support first.
— – —
FOLLOW Dr. Duru’s commentary on financial markets via email, StockTwits, Twitter, and even Instagram!
“Above the 40” uses the percentage of stocks trading above their respective 40-day moving averages (DMAs) to assess the technical health of the stock market and to identify extremes in market sentiment that are likely to reverse. Abbreviated as AT40, Above the 40 is an alternative label for “T2108” which was created by Worden. Learn more about T2108 on my T2108 Resource Page. AT200, or T2107, measures the percentage of stocks trading above their respective 200DMAs.
Active AT40 (T2108) periods: Day #4 over 20%, Day #2 over 30%, Day #11 under 40%, Day #11 under 50%, Day #12 under 60%, Day #18 under 70%
Daily AT40 (T2108)
")
Black line: AT40 (T2108) (% measured on the right)
Red line: Overbought threshold (70%); Blue line: Oversold threshold (20%)
Weekly AT40 (T2108)

*All charts created using freestockcharts.com unless otherwise stated
The charts above are my LATEST updates independent of the date of this given AT40 post. For my latest AT40 post click here.
Related links:
The AT40 (T2108) Resource Page
You can follow real-time T2108 commentary on twitter using the #T2108 or #AT40 hashtags. T2108-related trades and other trades are occasionally posted on twitter using the #120trade hashtag.
Be careful out there!
Full disclosure: long UVXY puts, long ALGN call
*Charting notes: FreeStockCharts.com uses midnight U.S. Eastern time as the close for currencies. Stock prices are not adjusted for dividends.