
AT40 = 18.1% of stocks are trading above their respective 40-day moving averages (DMAs) (oversold day #3)
AT200 = 43.9% of stocks are trading above their respective 200DMAs
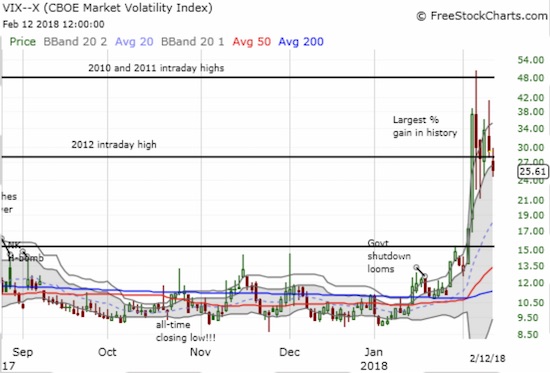
VIX = 25.6 (range from 24.4 to 29.7)
Short-term Trading Call: bullish
Commentary
My favorite technical indicator made a valiant effort, but it could not quite break out of oversold territory. AT40 (T2108), the percentage of stocks trading above their respective 40-day moving averages (DMAs), bounced as high as 20.2%, marginally above the 20% oversold threshold, but closed at 18.1%. This is day #3 of the oversold period. Since the typical oversold period only lasts 1 or 2 days, I am posting the chart below as a reminder of the S&P 500’s worsening performance the longer it stays oversold. A downward bias first appears after day #4.
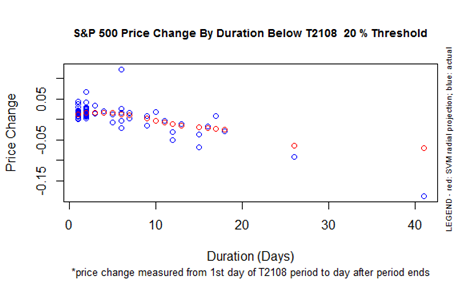
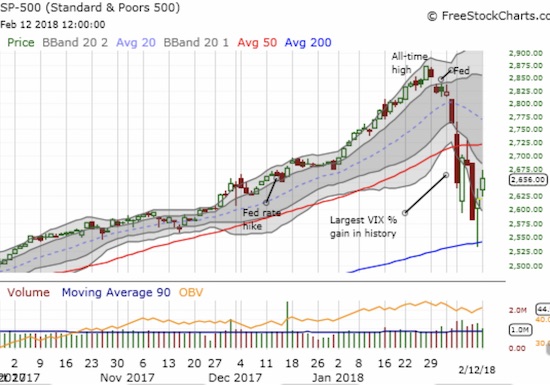
For reference, the S&P 500 (SPY) is up 2.9% for this oversold period so far. So if the oversold period ends after three days, the index’s performance is roughly in-line with historical patterns. For now, the S&P 500’s 1.4% gain confirmed the 200DMA as support but still left the index with the challenge of 50DMA overhead resistance.
The volatility index finally had a relatively calm day. The VIX dropped from 29.1 for a 11.9% decline. This is the VIX’s lowest close since a week ago when it soared for its largest percentage gain in its history.
My trading strategy for this oversold cycle remains the same. I will eagerly buy another dip inside oversold conditions, but I will be looking to sell those trades on a test of 50DMA resistance. A close AND follow-through above 50DMA resistance will be very bullish especially given AT40 would likely be surging out of oversold conditions at that point. A failure at 50DMA resistance would put a “cautiously” handle on my bullish short-term trading call. A breakdown below 200DMA support would put fresh concerns on my table.
CHART REVIEWS
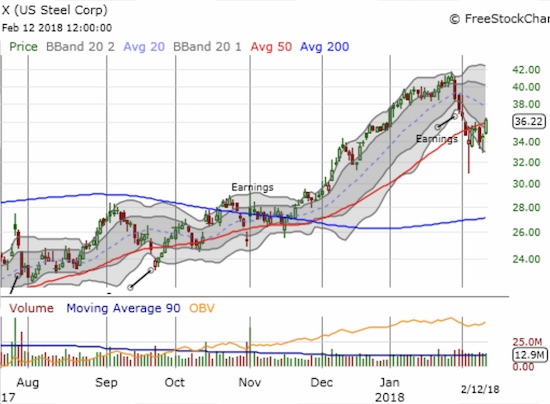
U.S. Steel (X) is on the move again and back on my shopping list. Today, it broke out above 50DMA resistance. The stock looks like it formed a new base from last week’s selling and churn, so I will likely accumulate from current levels down to about 33.
— – —
FOLLOW Dr. Duru’s commentary on financial markets via email, StockTwits, Twitter, and even Instagram!
“Above the 40” uses the percentage of stocks trading above their respective 40-day moving averages (DMAs) to assess the technical health of the stock market and to identify extremes in market sentiment that are likely to reverse. Abbreviated as AT40, Above the 40 is an alternative label for “T2108” which was created by Worden. Learn more about T2108 on my T2108 Resource Page. AT200, or T2107, measures the percentage of stocks trading above their respective 200DMAs.
Active AT40 (T2108) periods: Day #3 under 20% (oversold), Day #6 under 30%, Day #7 under 40%, Day #7 under 50%, Day #8 under 60%, Day #14 under 70%
Daily AT40 (T2108)
")
Black line: AT40 (T2108) (% measured on the right)
Red line: Overbought threshold (70%); Blue line: Oversold threshold (20%)
Weekly AT40 (T2108)

*All charts created using freestockcharts.com unless otherwise stated
The charts above are my LATEST updates independent of the date of this given AT40 post. For my latest AT40 post click here.
Related links:
The AT40 (T2108) Resource Page
You can follow real-time T2108 commentary on twitter using the #T2108 or #AT40 hashtags. T2108-related trades and other trades are occasionally posted on twitter using the #120trade hashtag.
Be careful out there!
Full disclosure: long UVXY puts, long SVXY calls
*Charting notes: FreeStockCharts.com uses midnight U.S. Eastern time as the close for currencies. Stock prices are not adjusted for dividends.