
AT40 = 52.9% of stocks are trading above their respective 40-day moving averages (DMAs)
AT200 = 55.9% of stocks are trading above their respective 200DMAs
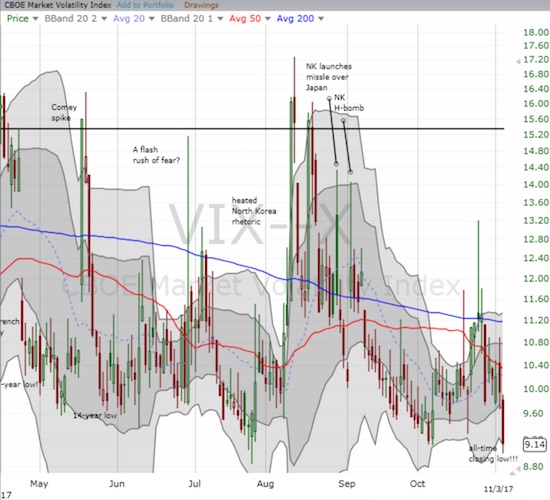
VIX = 9.1 (a new all-time low!)
Short-term Trading Call: cautiously bullish
Commentary
A week ago, I complained that AT40 (T2108), the percentage of stocks trading above their 40-day moving averages (DMAs), barely budged relative to the big move in the S&P 500 (SPY). I was looking for the week to bring a broadening of the rally and an assuring confirmation of the bullishness in the indices. Not only did the market fail to deliver, but the rally actually narrowed further. The S&P 500 ended the week at another all-time high on the heels of a strong response to Apple (AAPL) earnings. The index gained 0.3% on the day. The volatility index (VIX) plunged again, this time to another all-time low, and lost 8.0%. Yet, AT40 dropped to a new 6-week low at 52.9%. AT40 lost a little over 6 percentage points for the week.
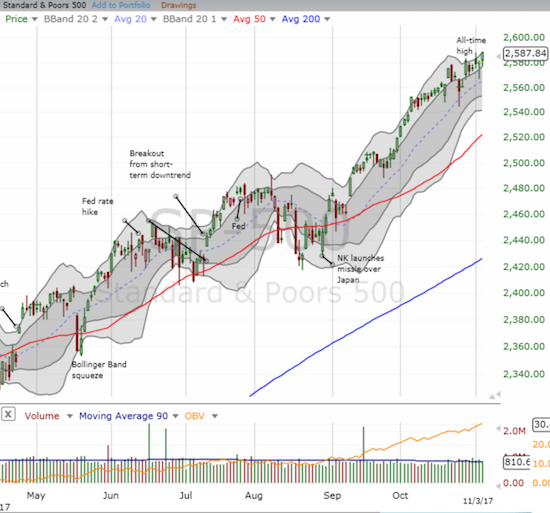
The divergence in behavior is bearish but far from confirmed as bearish. Just like the last episode of divergence, I am not trying to time the next pullback but instead preparing for a new buy-the-dip opportunity. The last dip that resolved the last bearish divergence was oh-so brief, and I expect more of the same for the next dip.
STOCK CHART REVIEWS
Apple (AAPL)
Almost enough said with AAPL’s chart. AAPL surged and gapped up 2.6% to a new all-time high after reporting earnings that pleased the market. This move is all the more impressive given AAPL skyrocketed into earnings. It looked like a move set up to disappoint!
I did not buy a fresh round of calls for the coming week. I am content to wait for a less stretched opportunity to restart one of my favorite trades.
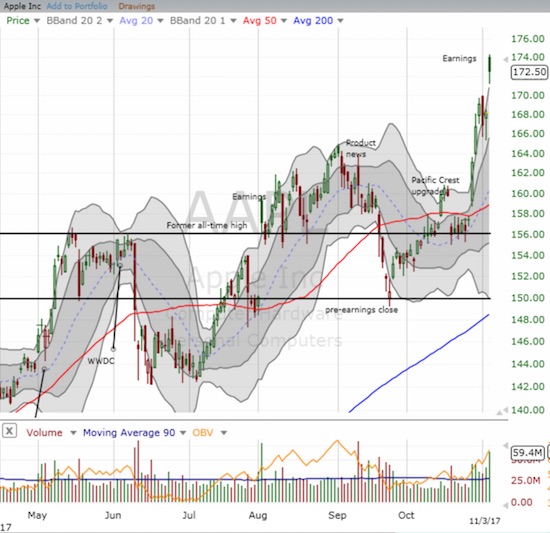
AAPL is now worth $886B in market cap. One trillion seems almost inevitable at this point – selling $1000 phones to a mass market should do the trick! For context, the U.S. economy is worth about $19.5 trillion dollars in current dollars with about 127M “usually” full-time workers. With just 116,000 employees, AAPL’s 4.5% share of the economy delivers no more than .09% of its jobs. That is one incredible sucking sound! Or from a more positive perspective…that is an incredible level of productivity! Of course companies like Alphabet (GOOG) are not too far behind…
— – —
FOLLOW Dr. Duru’s commentary on financial markets via email, StockTwits, Twitter, and even Instagram!
“Above the 40” uses the percentage of stocks trading above their respective 40-day moving averages (DMAs) to assess the technical health of the stock market and to identify extremes in market sentiment that are likely to reverse. Abbreviated as AT40, Above the 40 is an alternative label for “T2108” which was created by Worden. Learn more about T2108 on my T2108 Resource Page. AT200, or T2107, measures the percentage of stocks trading above their respective 200DMAs.
Active AT40 (T2108) periods: Day #427 over 20%, Day #241 over 30%, Day #41 over 40%, Day #41 over 50% (overperiod), Day #8 under 60% (underperiod), Day #15 under 70%
Daily AT40 (T2108)
")
Black line: AT40 (T2108) (% measured on the right)
Red line: Overbought threshold (70%); Blue line: Oversold threshold (20%)
Weekly AT40 (T2108)

*All charts created using freestockcharts.com unless otherwise stated
The charts above are my LATEST updates independent of the date of this given AT40 post. For my latest AT40 post click here.
Related links:
The T2108 Resource Page
You can follow real-time T2108 commentary on twitter using the #T2108 or #AT40 hashtags. T2108-related trades and other trades are occasionally posted on twitter using the #120trade hashtag.
Be careful out there!
Full disclosure: no positions
*Charting notes: FreeStockCharts.com uses midnight U.S. Eastern time as the close for currencies. Stock prices are not adjusted for dividends.