
AT40 = 59.3% of stocks are trading above their respective 40-day moving averages (DMAs)
AT200 = 57.8% of stocks are trading above their respective 200DMAs
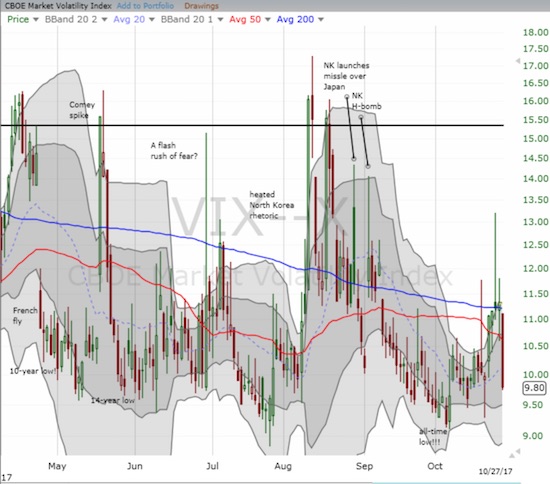
VIX = 9.8 (a 13.3% drop)
Short-term Trading Call: cautiously bullish
Commentary
Buyers ended last week on a strong note with the S&P 500 (SPY) surging to yet another all-time high. The move quickly invalidated the bearish engulfing pattern that started the week on a sour note.
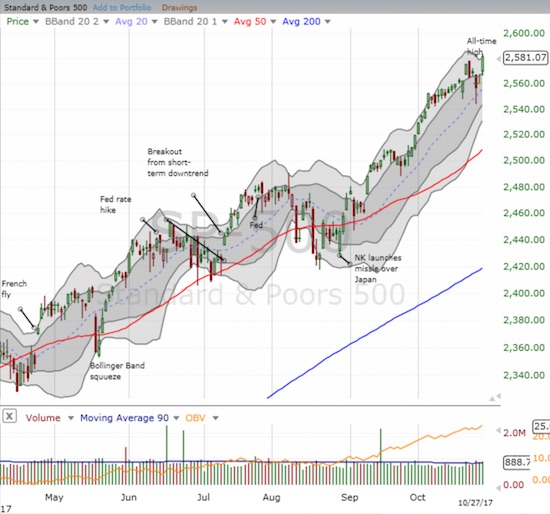
While the S&P 500 gained a respectable 0.8%, the NASDAQ soared 2.2% and the PowerShares QQQ ETF (QQQ) surged 2.9%. Both tech-laden representatives hit fresh all-time closing highs. Tech earnings were in full effect to produce the bulk of the day’s celebration. The volatility index, the VIX, added to the bullish feeling by imploding all over again for a 13.3% loss.
Yet, for all the bullish ripples on the surface, AT40 (T2108), the percentage of stocks trading above their respective 40-day moving averages (DMAs) only gained three percentage points to close at 59.3%. This small move of the needle suggests that Friday’s advance was relatively narrow. I am not overly surprised since big cap techs were all the rage on the day. I will be looking for the rally to broaden this week with AT40 even challenging the overbought threshold (70%). The biggest wildcard looks like the Federal Reserve’s meeting on Wednesday, November 1st.
STOCK CHART REVIEWS
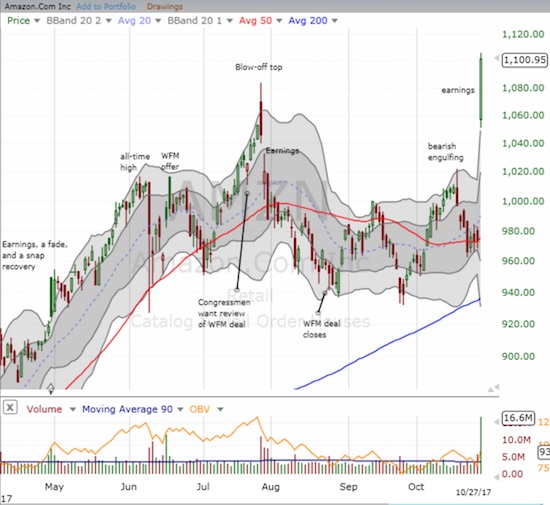
Amazon.com (AMZN)
AMZN was the clear star of the day as it not only drove up the tech indices but helped motivate buyers across big cap tech. The stock gapped up above its closing all-time high and never looked back. After the dust settled, the post-earnings move produced a whopping 13.2% gain. I failed to execute my “buy AMZN at the post-earnings open” trade. Clearly, it would have been a tremendous winner this time around!
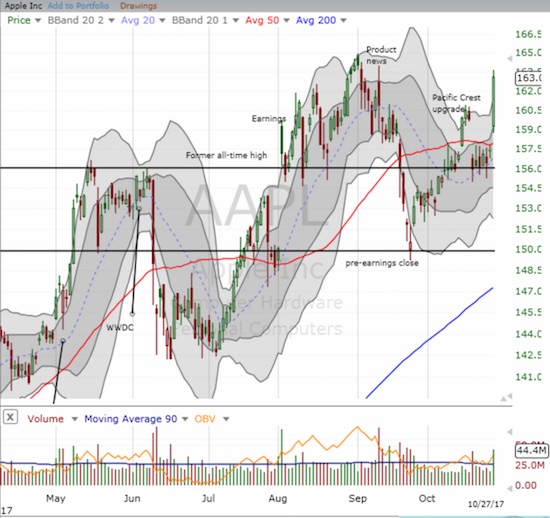
Apple (AAPL)
AAPL’s got next on the earnings front (November 2, 2017). In the middle of iPhone X news, traders and investors took their cues from big cap tech and rushed to get in ahead of the earnings report. AAPL gained an amazing 3.6%. I was sitting on a single call option as a part of my trade for the week. When AAPL gapped up, I was quite happy to lock in my profits when the stock traded around $160. I of course did not even begin to imagine the kind of day AAPL ended up experiencing! Needless to say, I am going into the current week AAPL-less.
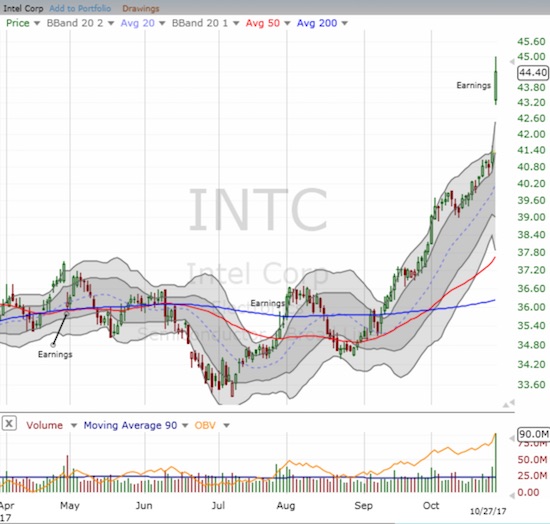
Intel (INTC)
I have been in the habit of loading up on INTC call options between earnings, waiting for a dip to make the first buys. I think Friday’s historic 7.4% post-earnings gap up makes it highly unlikely I will get a comfortable entry point to make such trades this upcoming cycle! INTC closed at a 17-year high.
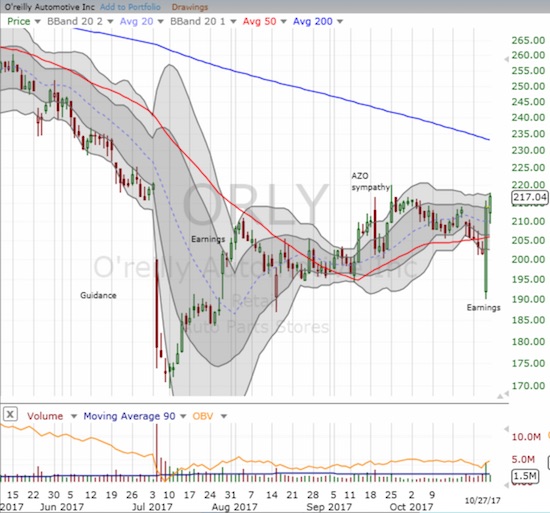
O’Reilly Automotive (ORLY)
In my last Above the 40 post, I lamented that a poor after hours response to earnings from ORLY signaled the likely end of the bottoming of auto parts plays. So imagine my surprise when buyers stepped in right at the gap down on the open. ORLY has yet to look back and has managed to turn defeat into a ringing confirmation of a bottoming process underway.
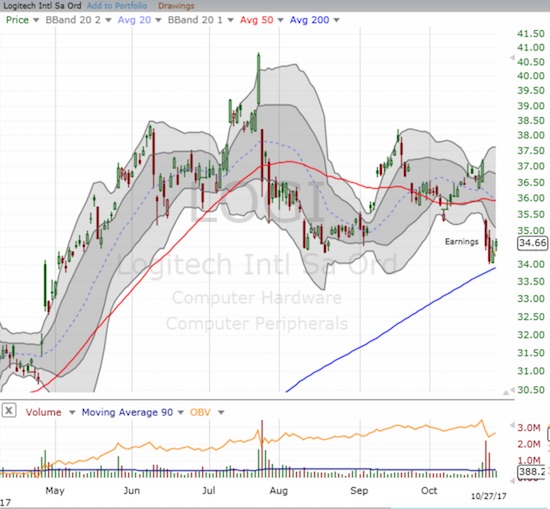
Logitech (LOGI)
With tech coming on strong again, I am eyeing LOGI closely. The stock tumbled after earnings last week, but it refuses to buckle beneath its 200DMA support. LOGI could be signaling a buying opportunity with a clear stop below $33.75.
— – —
FOLLOW Dr. Duru’s commentary on financial markets via email, StockTwits, Twitter, and even Instagram!
“Above the 40” uses the percentage of stocks trading above their respective 40-day moving averages (DMAs) to assess the technical health of the stock market and to identify extremes in market sentiment that are likely to reverse. Abbreviated as AT40, Above the 40 is an alternative label for “T2108” which was created by Worden. Learn more about T2108 on my T2108 Resource Page. AT200, or T2107, measures the percentage of stocks trading above their respective 200DMAs.
Active AT40 (T2108) periods: Day #422 over 20%, Day #236 over 30%, Day #36 over 40%, Day #35 over 50% (overperiod), Day #3 under 60% (underperiod), Day #10 under 70%
Daily AT40 (T2108)
")
Black line: AT40 (T2108) (% measured on the right)
Red line: Overbought threshold (70%); Blue line: Oversold threshold (20%)
Weekly AT40 (T2108)

*All charts created using freestockcharts.com unless otherwise stated
The charts above are my LATEST updates independent of the date of this given AT40 post. For my latest AT40 post click here.
Related links:
The T2108 Resource Page
You can follow real-time T2108 commentary on twitter using the #T2108 or #AT40 hashtags. T2108-related trades and other trades are occasionally posted on twitter using the #120trade hashtag.
Be careful out there!
Full disclosure: no positions
*Charting notes: FreeStockCharts.com uses midnight U.S. Eastern time as the close for currencies. Stock prices are not adjusted for dividends.