AT40 = 67.2% of stocks are trading above their respective 40-day moving averages (DMAs) – ended 12 straight days overbought
AT200 = 60.3% of stocks are trading above their respective 200DMAs
VIX = 10.0
Short-term Trading Call: bullish
Commentary
On Monday, the S&P 500 (SPY) went into a bearish divergence with AT40 (T2108), the percentage of stocks trading above their respective 40-day moving averages (DMAs). However, I explained why I decided to keep the trading call on bullish…and things worked out. On Friday, the S&P 500 gapped up to a fresh all-time high.
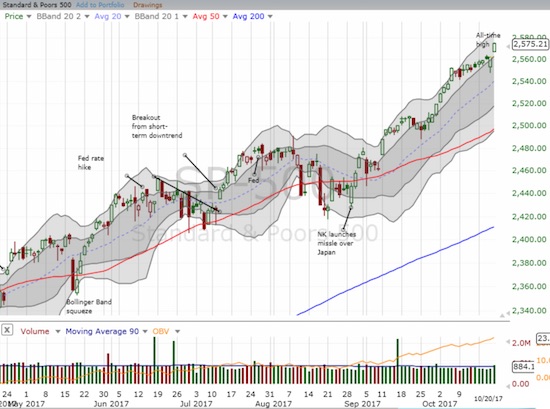
AT40 closed at 67.1%, its first daily gain in 6 trading days. When the S&P 500 gapped down on Thursday, I started to wonder whether a confirmation of the bearish divergence was underway. Buyers quickly dismissed such concerns as they immediately bought the gap and never looked back (see the chart above). The gap down was a bit mysterious, but I suppose the 30-year anniversary of the 1987 stock market crash provided a convincing driver to some traders.
Don’t call it a crash, it’s a correction…
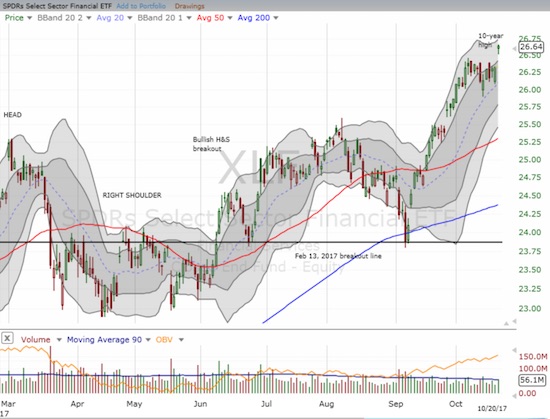
Other key indices provided good confirmation of the continuation of bullishness.
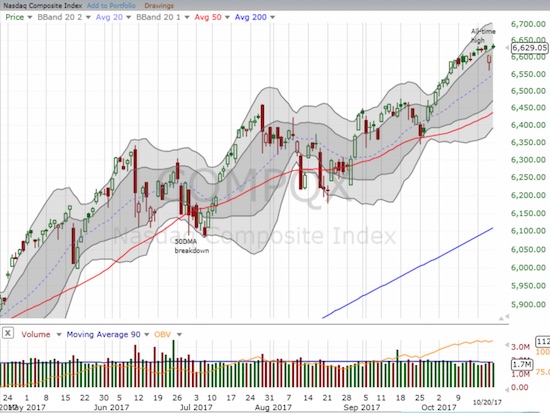
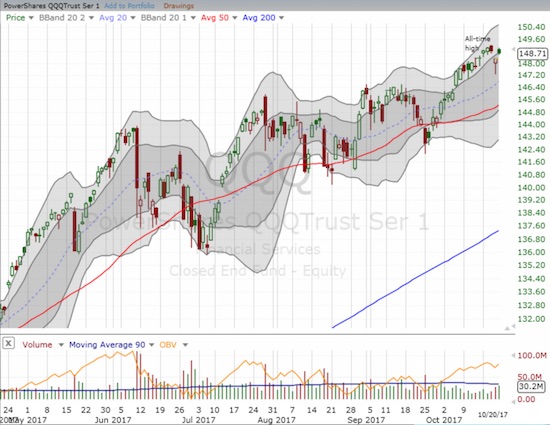
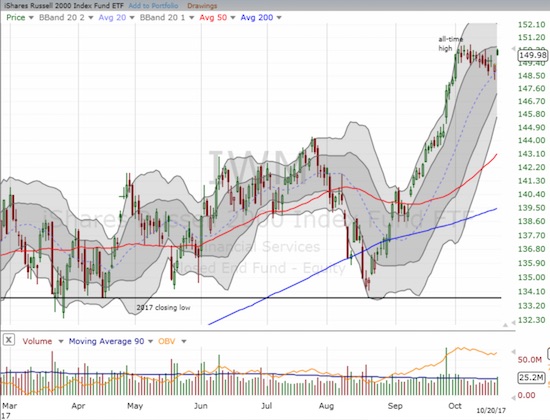
The volatility index, the VIX, experienced yo-yo kind of trading the past two days. Volatility faders went right to work after the stock market opened with a gap down. On Friday, volatility sellers were unable to hold the VIX close to its all-time low.
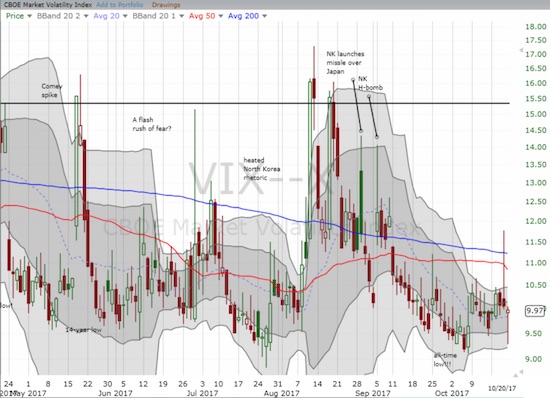
As a reminder, given earnings season is in full swing, market conditions and technicals can change on a dime!
STOCK CHART REVIEWS
Apple (AAPL)
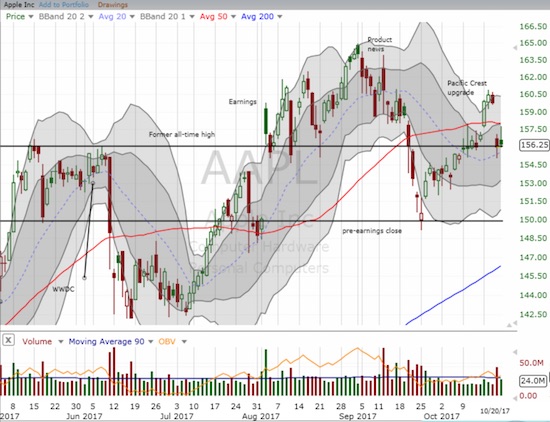
AAPL started off the week very strong with a gap up and an almost 3% gain. It ended the week a tad below where it ended the last week. This yo-yo trading keeps AAPL out of synch with the overall market. I missed the trade last week and chased a bit to my detriment. I am back to my proper positioning for the coming week.
Chipotle Mexican Grill (CMG)
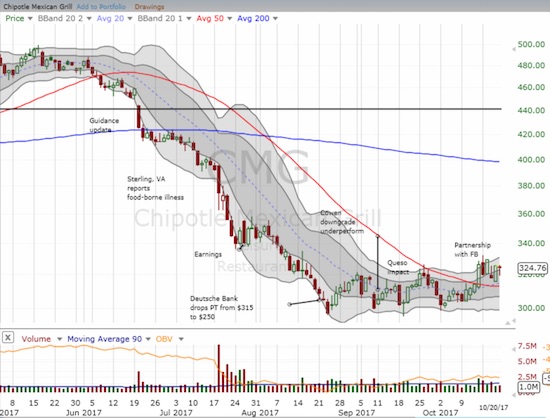
Analysts were busy issuing report cards on CMG all week. The action caused and threw off my timing for the week on short-term CMG trades. I am still long shares as I see a bottom forming. I am bracing myself for earnings but hoping there is just enough positivity to hold support at the recent lows.
Ulta Beauty (ULTA)
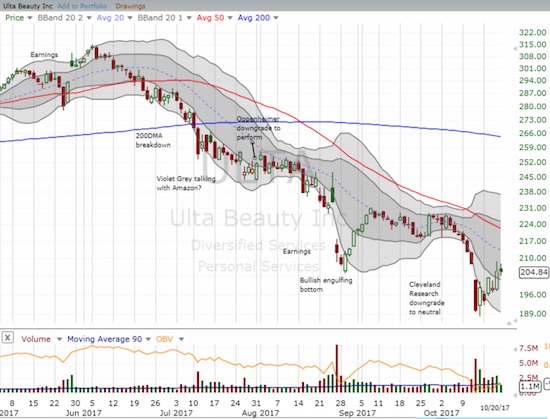
Speaking of bottoms, ULTA is also close to confirming a bottom. I thought the downgrade-driven gap down and deep selling marked the beginning of a fresh sell-off, but sellers never followed through. Instead, ULTA closed the gap on an intraday basis on Thursday. Earnings do not come for another month, so the stock has plenty of time to confirm a bottom…ideally with a 50DMA breakout AND a close above the September congestion (so above $231 which would also close the gap from August earnings). It will take a new low or a distinct failure at declining 50DMA resistance to get me bearish again.
Amazon.com (AMZN)
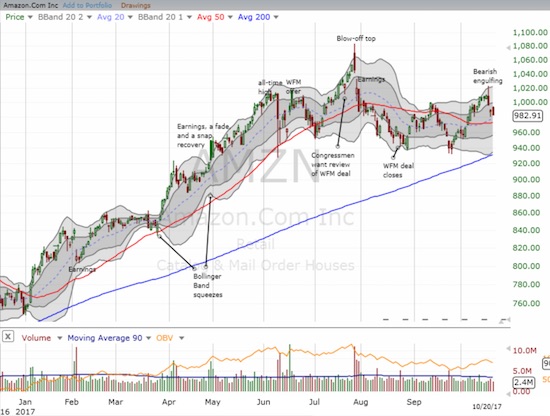
AMZN has not struggled like this for a long time.
AMZN cannot seem to break free of the $1000 mark. The gap down from July earnings has actually held as resistance for AMZN and two attempts to reclaim $1000 since then have melted away into fresh selling. The latest attempt was last week, and it ended with another bearish engulfing pattern. The current extended pattern of struggle, punctuated with the blow-off top ahead of earnings, makes AMZN look bearish. However, the stock is far from confirming such a change in bias: it will take a close and follow-through below 200DMA support.
U.S. Steel (X)
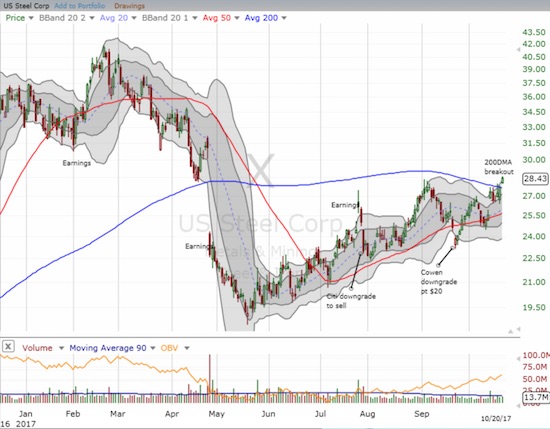
The inexorable march to close the massive April post-earnings gap down continues for U.S. Steel. On Friday, X broke out above its 200DMA resistance with a new high since the April earnings disaster. The recovery from the Cowen downgrade allowed me to sell my call options at a profit. I did not make a fresh trade after X returned to another test of 50DMA support. Earnings are coming up on October 31st, so I am not particularly excited about playing this bullish breakout. I might reconsider if X manages to put on another strong show of buying interest as follow-through to the breakout.
— – —
FOLLOW Dr. Duru’s commentary on financial markets via email, StockTwits, Twitter, and even Instagram!
“Above the 40” uses the percentage of stocks trading above their respective 40-day moving averages (DMAs) to assess the technical health of the stock market and to identify extremes in market sentiment that are likely to reverse. Abbreviated as AT40, Above the 40 is an alternative label for “T2108” which was created by Worden. Learn more about T2108 on my T2108 Resource Page. AT200, or T2107, measures the percentage of stocks trading above their respective 200DMAs.
Active AT40 (T2108) periods: Day #417 over 20%, Day #231 over 30%, Day #31 over 40%, Day #30 over 50%, Day #26 over 60%, Day #5 under 70%
Daily AT40 (T2108)

Black line: AT40 (T2108) (% measured on the right)
Red line: Overbought threshold (70%); Blue line: Oversold threshold (20%)
Weekly AT40 (T2108)

*All charts created using freestockcharts.com unless otherwise stated
The charts above are my LATEST updates independent of the date of this given AT40 post. For my latest AT40 post click here.
Related links:
The T2108 Resource Page
You can follow real-time T2108 commentary on twitter using the #T2108 or #AT40 hashtags. T2108-related trades and other trades are occasionally posted on twitter using the #120trade hashtag.
Be careful out there!
Full disclosure: long AAPL call, long CMG, long UVXY call options, long XLF call options
*Charting notes: FreeStockCharts.com uses midnight U.S. Eastern time as the close for currencies. Stock prices are not adjusted for dividends.
