
The volatility index, the VIX, has closed below 11 for 5 straight days and 22 of the last 25. These stretches of extremely low volatility (I will now shorten it to ELV for convenience) include a 14-year low for the VIX. The interruption in this streak of ELV included an abrupt wake-up call where the VIX soared 46% for a tie as the 6th largest one-day surge on record (data available through 1990). This has been quite a period of extremes!
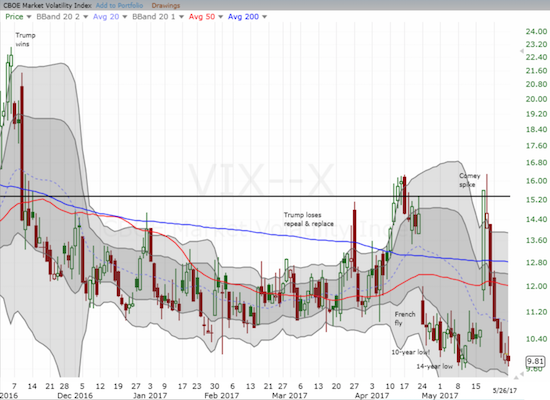
The sudden burst in volatility was short-lived and demonstrated once again the bullish bias of periods of ELV. The S&P 500’s maximum drawdown was 2.0% before volatility imploded all over again. When I wrote in February about the surprising implications of periods of extremely low volatility, I noted the length of time it took from the end of a period of ELV to the time the S&P 500 (SPY) experienced at least a 5% drawdown. Based on the average 77 trading days, I pointed to a pullback in mid-May. However, the VIX fell below 11 again on March 3rd and, presumably, extended out the timeline. More importantly, the current period of ELV has reset the timeline all over again.
Now that the S&P 500 has missed its destiny for a pullback in May, I am taking a different perspective on the data. In the previous post, I pointed to the ominous meaning of the streak of three straight periods of ELV leading to 5% or worse pullbacks in the S&P 500. With ELV period number #13 ending without the pullback, I need to reconsider the larger importance of the rarity of significant pullbacks following an ELV.
I updated my list of periods of ELV, now totaling 14 including the current one, and added info on the S&P 500’s vicinity to an all-time high. The list includes the start date followed by the duration of the period of ELV measured in trading days. I put an asterisk next to the periods that preceded a 5% pullback in the S&P 500 as measured from the last day of the period of ELV to the intraday low of the day that delivered the first accumulated 5% loss (I used this measure as it represents the full extent of the market risk). I follow the info with the S&P 500’s percentage distance from the last all-time high in parentheses.
4/15/93: 1 (-1.7%)
7/9/93: 6 (-1.8%)
10/15/93: 1 (0%)
*12/13/93: 38 (-0.8%)
2/3/95: 15 (-0.7%)
*6/16/95: 1 (0%)
12/4/95: 14 (0%)
7/12/05: 13 (-20.0%)
11/21/05: 35 (-17.8%)
*3/14/06: 14 (-15.1%)
*10/13/06: 90 (-10.6%)
*6/6/14: 20 (0%)
1/25/17: 27 (0%)
4/24/17: ? (-0.9%)
Of the 13 completed periods of extremely low volatility, only FIVE (38%) preceded pullbacks of at least 5% for the S&P 500 as measured from the last day of the period. Of these 5 periods that preceded pullbacks, two began at all-time highs on the S&P 500 and two started at significant distance from the all-time high. An ELV has coincided with an all-time high on the S&P 500 just 5 times. With THIS perspective, I think it is essentially a coin toss (50/50) as to whether this current period of ELV that started on April 24th generates a drawdown of at least 5%. In other words, bears who want to short the market simply because volatility is at historically low levels are still taking a greater risk than we might otherwise assume.
Not only is there risk that the next pullback may not happen until the S&P 500 is trading at much higher levels, but also, even if a profitable pullback arrives, a significant amount of time may pass first. This extended period of time before a sell-off is a testament to the tremendous buying power (and/or complacency) that is required to push the VIX so low. To measure the time-to-weakness, I calculated the change in the S&P 500 as measured from the last day the VIX traded below 11. From there, I counted off the number of trading days it took for the S&P 500 to lose at least 5%. Since we cannot know in advance when the period of extremely low volatility will end, I include in parentheses the total days to weakness as measured from the first day of the period. The date is the date the pullback reached at least 5%.
3/28/94: 36 (73)
10/12/05: 53 (65)
6/8/06: 49 (62)
3/5/07: 6 (95)
10/13/14: 70 (89)
Note that even when a pullback quickly followed the end of a period of extremely low volatility, that period lasted a very long time! For these 5 occurrences, the average amount of trading days until a drawdown of at least 5% was 77 trading days from the beginning of the period of ELV. If that average prevails for the current period, the 5% pullback will occur around early August – the start of the S&P 500’s most dangerous three months of the year.
For additional reference, I post below an updated distribution chart that shows the percent of time the VIX spends at various levels.
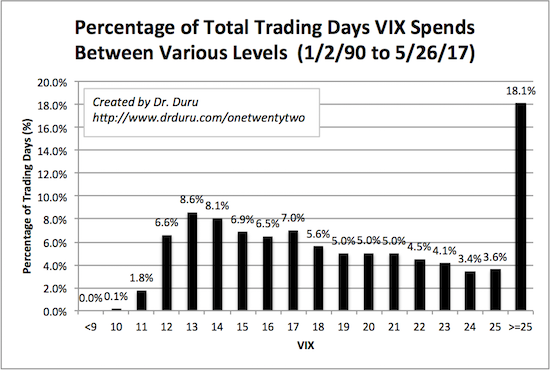
Source of data: Yahoo Finance
(You can review the data and its analysis by clicking here to download the Excel spreadsheet.)
In the last post on ELV, I reviewed Barron’s recommendation for trading volatility: CBOE Holdings, Inc. (CBOE). CBOE offers the volatility-based trading vehicles that have gained tremendous appeal given the strong and disparate opinions on volatility. I never made the trade myself and regret missing the 9.5% gain since then (compare to the 3.7% gain on the S&P 500).
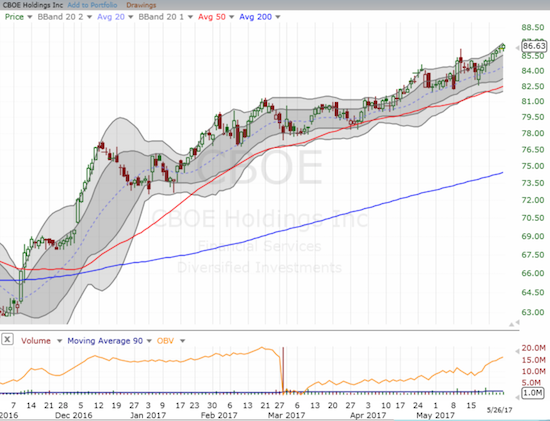
Source: FreeStockCharts.com
Even the bet against volatility, the ProShares Short VIX Short-Term Futures (SVXY), continues to outperform the S&P 500 by a large amount. Since my last post in mid-February, SVXY has gained 18.6%. Ironically, the large dip from the Trump Turmoil took SVXY almost back to that mid-February point. There was also an even better buying opportunity in April.
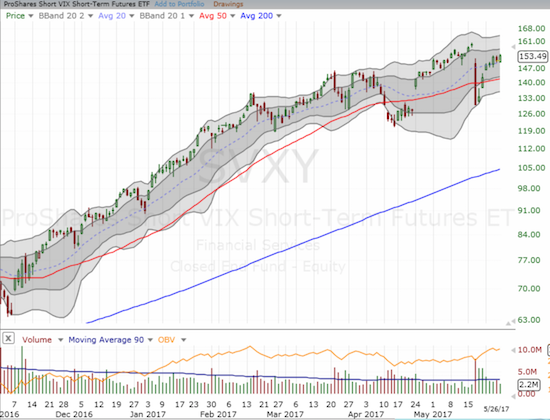
Source: FreeStockCharts.com
I think it is clear plays on volatility will be a centerpiece of market action and trades for the foreseeable future. Through it all traders should remember that extremely low volatility is just as likely a very bullish sign as it is a bearish sign…and bearish outcomes may come with significant delays and less immediate carnage than one might suspect.
For a good education on how to use volatility in trading options see this segment from the CME Group: “Volatility Jam Session, Aligning Your Options Strategies with Volatility.”
Be careful out there!
Full disclosure: long UVXY call options
Although the presentation could be better – and I found the occasional wrong words and digressions distracting – I agree the CME group video is well worthwhile.
However, it reminded me that volatility pricing is based on historical data – but dominated by *recent* history. Obviously, if 2008’s data was weighted the same as 2016’s, the VIX would not currently be below 10.
Analogous to how human sentiment feedback drives equity price momentum, I think this price calculation “nearsightedness” drives VIX momentum.