
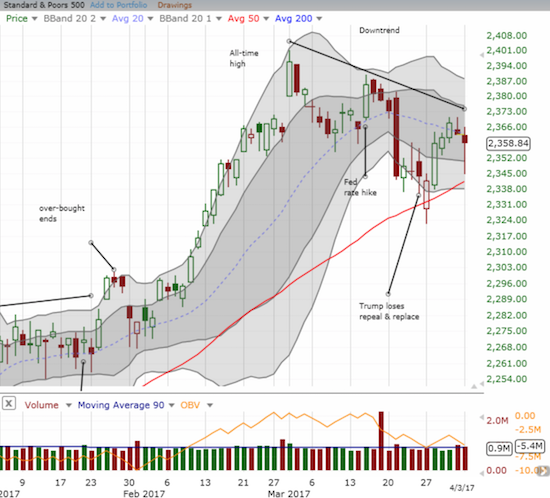
Bears have taken numerous shots yet the bulls have consistently blocked them all. The S&P 500 (SPY) is barely off its all-time highs and has survived all number of setbacks. These setbacks seem to get more and more shallow.
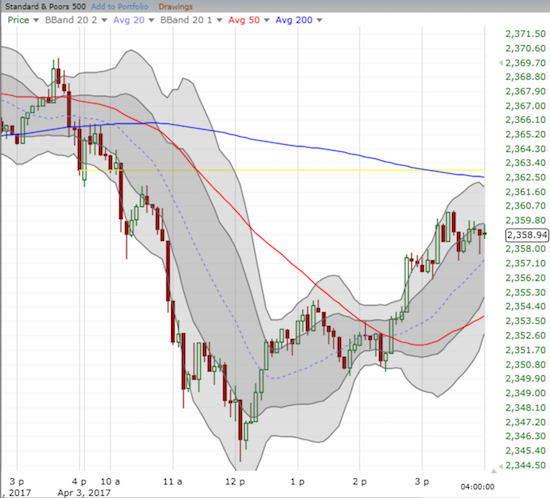
Monday, April 3rd, 2017 delivered another classic example. The morning began with very convincing selling. It looked like big money was finally ready to lock in profits and retreat. The S&P 500 (SPY) followed through on Friday’s wickedly weak close in a move that looked like it confirmed the short-term downtrend and the downtrend from the 20-day moving average (DMA). Yet, once again, the sellers failed to seal the deal as buyers roared back. The index just missed touching its 50DMA uptrending support.
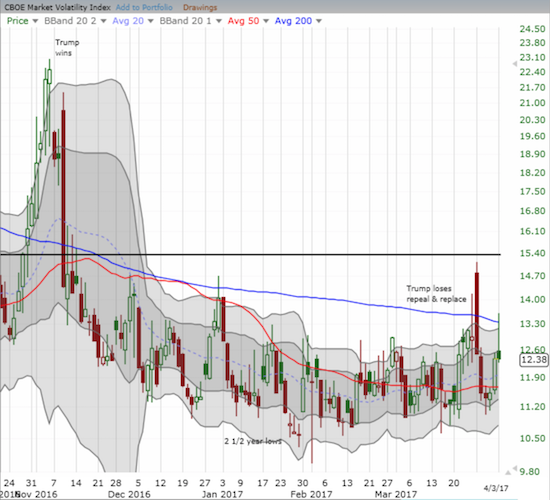
The volatility index, the VIX, was the exclamation point on the failure of the bears to hold the advantage. The VIX soared as much as 9.9% before completely imploding. The VIX quickly went from confirming Friday’s hint of sudden fear to confirming the stubborn resilience of the “bargain shoppers.”
Today’s action sent me back to an interesting interview on Nightly Business Report, last week on March 30th, with stock market psychologist Dr. Doug Hirschhorn. Dr. Hirschhorn discussed the psychology of a market whose exuberant confidence is disconnected from “reality.” The lead-in from the transcript:
“And while GDP and other economic data are meddling along, indicators that measure optimism are soaring. Take consumer confidence, just the other day, we told you that it stands at the highest level since all the way back in 2000. And there’s margin debt, the amount of money borrowed to buy stocks. It’s an all time high, and that means investors are feeling pretty optimistic about the prospects for the market.”
For those of us accustomed to the market’s forward-looking behavior, we can easily explain this “disconnect” as traders and investors looking forward to a day that is better than today. However, Hirschhorn took his explanation down another level of sentiment. He explained that the market is experiencing the same thing in sports when a new coach comes to town: aspirations abound and hope freshens about the difference change will bring. However, Hirschhorn claimed that the new coach (aka President Donald Trump) is still working with the same team (the economy). I think this particular analogy is a bit extended: even through an abundance of executive orders, Trump and his team do have enough power to at least alter the contours of the American (and even the global) economy.
Regardless, Hirschhorn made an even stronger claim that Trump’s charisma is charming the market into an obedient optimism:
“I refer to this as the Jedi mind trick. President Trump, it isn’t a political conversation, but he’s charismatic, he’s engaging, he uses great compelling words like fantastic and great and wonderful. And those words stick in our minds, and then we move forward with that analogy in our head.”
Whether or not you agree with Hirschhorn’s characterization of the market set-up and psychology, I think his advocacy for independent thinking as a way to ward off the market’s snake charms should resonate. I think the following statement is a key point of advice for surviving the influence of market psychology (emphasis mine):
“…go back to the data and the best thing you can do is to recognize that you are having this over anxious or overconfident feeling, and then go back to data points and look for pros and cons, break it down to an objective list of pros and cons. Another great tool you can use is, look at who you are having conversations with, what chat rooms or blogs you are reading. And so, if you are surrounding yourself with like minded people, that is a red flag that you lost objectivity in what’s going on around you.”
Regular readers know that my favorite tool is AT40 (T2108), the percentage of stocks trading above their respective 40DMAs. When my favorite technical indicator is at its best, it flags overbought and oversold extremes which help mark the ends of rallies and sell-offs respectively. Right around the moment I might be tempted to get overwhelmed by the sentiment of the moment, AT40 helps me think more independently.
Right now, AT40 is not flagging an extreme in optimism. I even just flipped to “cautiously” bullish. At the time, I acknowledged that I was pushing things a bit given the S&P 500’s short-term downtrend remained intact and the index has not quite reversed the big sell-off day. The S&P 500’s bounce off 50DMA support helped convince me to commit to a more bullish case…even if it turns out that the market is finally ready to sell into oversold territory.
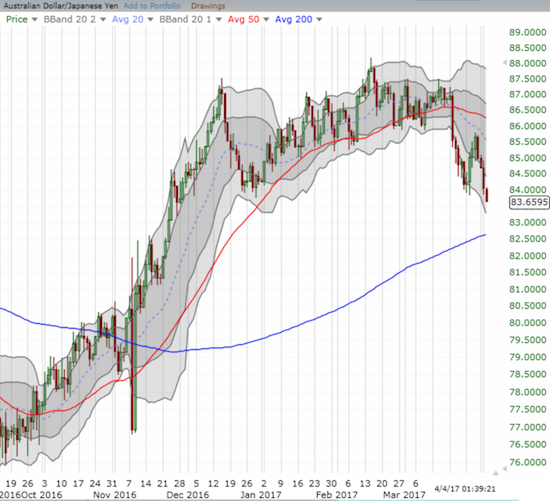
One additional signal that DOES have me worried about the bull is the Australian dollar (FXA) versus the Japanese yen (FXY). AUD/JPY never recovered intraday along with the stock market. At the time of writing, AUD/JPY continues to sell-off and is at a 5-month low. I think this move confirms a top in AUD/JPY and puts its 200DMA support into play. I will be watching closely to see whether the market continues its loose correlation with my favorite indicator from forex.
Source for charts: FreeStockCharts.com
In the meantime, I will do my best to avoid getting seduced by the market’s near uncanny resilience and the consistent failure of sellers to mount a serious threat to the thesis of the buyers and optimists.
Full disclosure: long SSO shares, long UVXY call and put options, long SSO call opttions