
(T2108 measures the percentage of stocks trading above their respective 40-day moving averages [DMAs]. It helps to identify extremes in market sentiment that are likely to reverse. To learn more about it, see my T2108 Resource Page. You can follow real-time T2108 commentary on twitter using the #T2108 hashtag. T2108-related trades and other trades are occasionally posted on twitter using the #120trade hashtag. T2107 measures the percentage of stocks trading above their respective 200DMAs)
T2108 Status: 59.4%
T2107 Status: 66.7%
VIX Status: 11.5
General (Short-term) Trading Call: bearish
Active T2108 periods: Day #231 over 20%, Day #51 over 30%, Day #50 over 40%, Day #48 over 50% (overperiod), Day #2 under 60% (underperiod), Day #11 under 70%
Commentary
I had hoped that the inauguration of Donald J. Trump as the 45th President of the United States would provide a catalyst to nudge the market into the direction of its next big move. No such luck. It was another blah day on the market as the S&P 500 (SPY) gained 0.3% with the high of the day neatly stopping near the top of the current trading range.
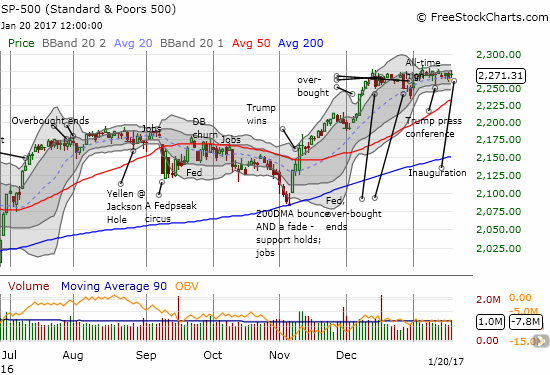
T2108, the percentage of stocks trading above their respective 40-day moving averages (DMAs), bounced back from the drubbing it took on Inauguration Eve. The close at 59.4% still keeps my favorite technical indicator locked into its current downtrend and maintains the on-going bearish divergence with the market.
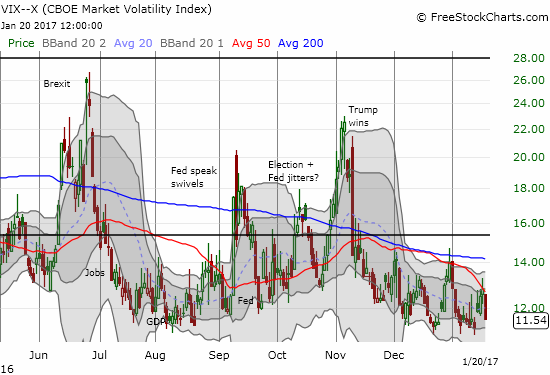
Interestingly, the volatility index, the VIX, DID make a big move. The VIX plunged 9.7% to drop toward its recent lows. It never even occurred to me that the last rise in volatility was related to lingering anxieties over the inauguration. Otherwise, I would have proposed fading volatility as part of a very short-term trade, similar to the post-Fed fade of volatility.
The currency markets were another focal point given Trump’s earlier comments about the excessive strength of the U.S. dollar (DXY0). The index fell 0.5% in a move that could be the beginning of a confirmation of resistance at the still uptrending 50DMA.
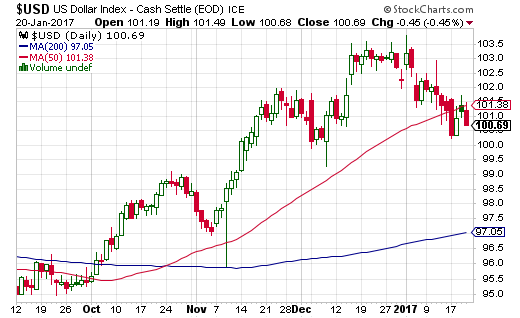
Source: StockCharts.com
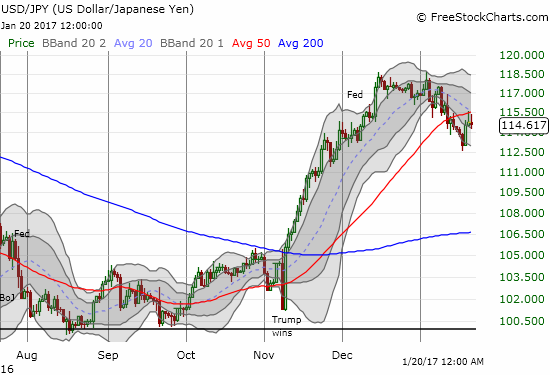
Since Trump’s views on the dollar are all about trade, I am most interested in the behavior of the trade sensitive dollar pairs like the dollar vs the Japanese yen (FXY) and the U.S. dollar versus the Canadian dollar (FXC). For the last two days, USD/JPY rallied only to get stopped cold at 50DMA resistance. That resistance now coincides with a downtrending 20DMA. The technical pressures are running against USD/JPY. However, if USD/JPY manages to jump above all this resistance, I will get aggressively bullish on this pair and significantly add to my currently small long position.
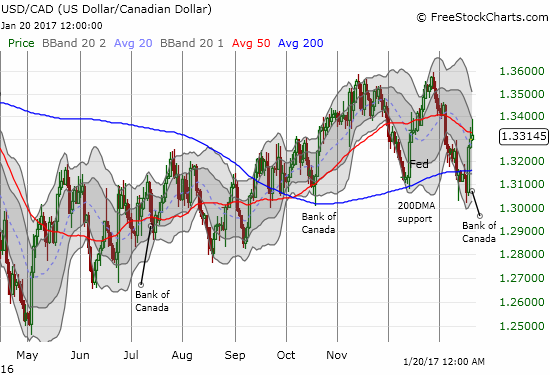
The Bank of Canada released its latest report on monetary policy last Wednesday. The press conference was full of talk of the impact of Trump’s economic policies. This report was likely an extremely important turning point for the Canadian dollar, so I hope to cover the details in another post. For now, it is important to note that the Canadian dollar has notably weakened since the Bank of Canada released its report. The week closed with USD/CAD below 50DMA resistance so the jury is still out.
With inauguration in the rear view mirror, the wildcard returns to earnings season. International Business Machines (IBM) delivered quite a display of post-earnings resiliency in the background of the inauguration. Headline results appeared weak once again with IBM notching an incredible 19th straight year-over-year decline in quarterly revenue. IBM opened higher, dipped to the bottom of the recent trading range, and then surged into the close with a 2.2% gain. IBM now sits at a 1 1/2 year high.
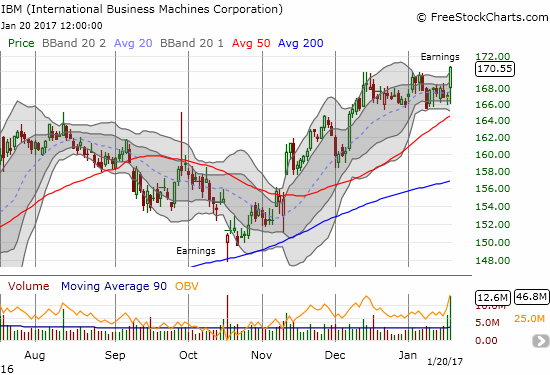
So, if IBM is any sign, plenty of buyers are lurking around ready to buy the slightest of dips. I will be watching for similar behaviors in the coming two weeks of earnings. In the meantime, I am sticking with the short-term bearish trading call in deference to the on-going bearish divergence driven by T2108’s downtrend. I am still not doing anything aggressively bearish, but I am looking for a good excuse to do so. My short-term trading call will flip to neutral if T2108 returns to overbought conditions on new all-time highs for the S&P 500. A flip to bullish will depend on other signals.
— – —
FOLLOW Dr. Duru’s commentary on financial markets via email, StockTwits, Twitter, and even Instagram!
Daily T2108 vs the S&P 500
")
Black line: T2108 (measured on the right); Green line: S&P 500 (for comparative purposes)
Red line: T2108 Overbought (70%); Blue line: T2108 Oversold (20%)
Weekly T2108

*All charts created using freestockcharts.com unless otherwise stated
The charts above are the my LATEST updates independent of the date of this given T2108 post. For my latest T2108 post click here.
Related links:
The T2108 Resource Page
Be careful out there!
Full disclosure: long SDS, long USD/JPY, long USD/CAD