
(This is an excerpt from an article I originally published on Seeking Alpha on January 9, 2017. Click here to read the entire piece.)
Two years ago, I wrote “The Problem with the January Barometer.” {snip}… the January barometer failed one more time with 2016 delivering a stellar 9.5% gain. Hopefully, 2016 helps put the January barometer to rest. In fact, perhaps the January barometer could better be stated as “buy the dip at the end of a down January.”
So let’s review the updated numbers.
{snip} Regardless of any given month’s performance, you can simply bet on an up year.
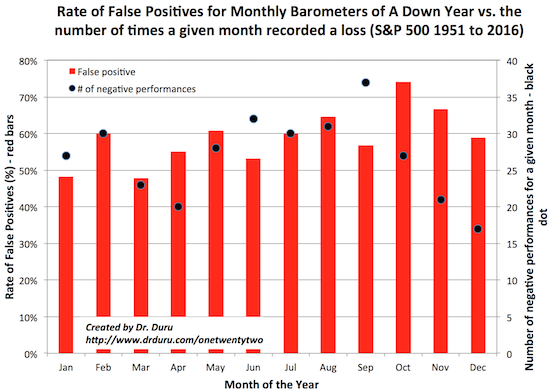
{snip} Since there are only 18 negative years since 1951, I can use a heat map to compare the performance of each month of a negatively performing year to see whether there is even a chance of getting a reliable prediction. {snip}

Source for prices: Yahoo Finance
{snip} The following chart shows the rate of false positives by month (red bar, left vertical axis) alongside the total number of months with negative performances (black dots, right vertical axis).
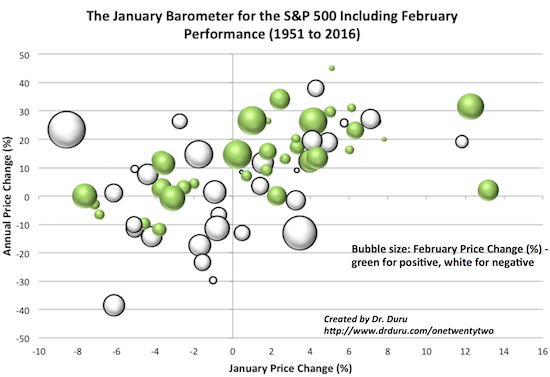
Finally, just to underline the weakness of the January barometer, I generated a bubble chart of the January barometer married to the performance of February. {snip}
Bottom-line: the failure of the January barometer in 2016 essentially confirms its lack of usefulness. The barometer would be much more useful as a buying signal to get the year’s performance at a likely discount. Going into 2017, my trading focused on confirming (calendar-independent) signals that are flashing bearish. I describe my latest assessment in “A Surprising Bearish Divergence for the S&P 500.” I was expecting a fresh breakout to new all-time highs on the S&P 500 to refresh the bullish signs in the market that were in place in the days preceding the U.S. Presidential election. Instead, I found surprising signs of underlying weakness. Regardless of the way these signals resolve, I recognize that resolution into a negative January performance will NOT reliably predict a negative year.
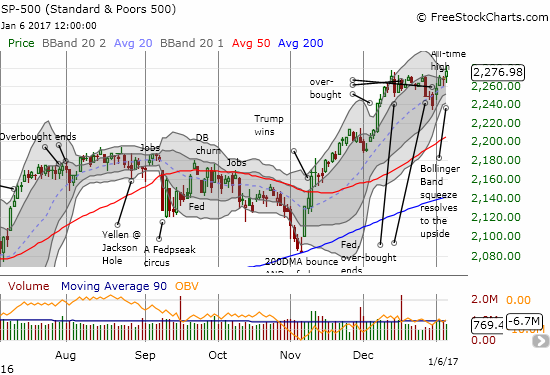
Source: FreeStockCharts.com
(For those interested, you can click here to download and review the Excel spreadsheet I used for this analysis).
Be careful out there!
Full disclosure: long SDS
(This is an excerpt from an article I originally published on Seeking Alpha on January 9, 2017. Click here to read the entire piece.)