(T2108 measures the percentage of stocks trading above their respective 40-day moving averages [DMAs]. It helps to identify extremes in market sentiment that are likely to reverse. To learn more about it, see my T2108 Resource Page. You can follow real-time T2108 commentary on twitter using the #T2108 hashtag. T2108-related trades and other trades are occasionally posted on twitter using the #120trade hashtag. T2107 measures the percentage of stocks trading above their respective 200DMAs)
T2108 Status: 68.1% (as high as 70.5%)
T2107 Status: 63.8%
VIX Status: 12.8
General (Short-term) Trading Call: cautiously bearish
Active T2108 periods: Day #207 over 20%, Day #27 over 30%, Day #26 over 40%, Day #24 over 50%, Day #18 over 60%, Day #2 under 70%
Commentary
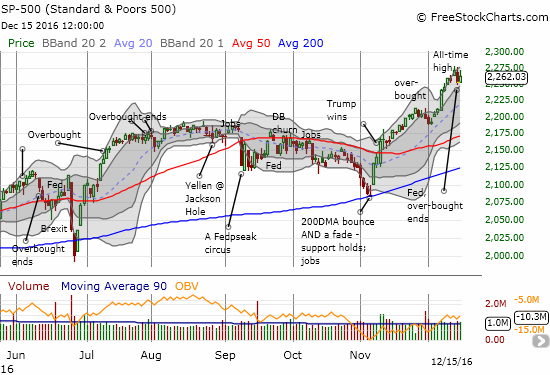
The S&P 500 (SPY) made a great effort to recover the momentum and bullish feeling that it lost in the hangover from yesterday’s Federal Reserve announcement of monetary policy. At its high of the day, the index recovered all of the previous day’s loss. Sellers returned at that point to push the S&P 500 backward and a smaller 0.4% gain.
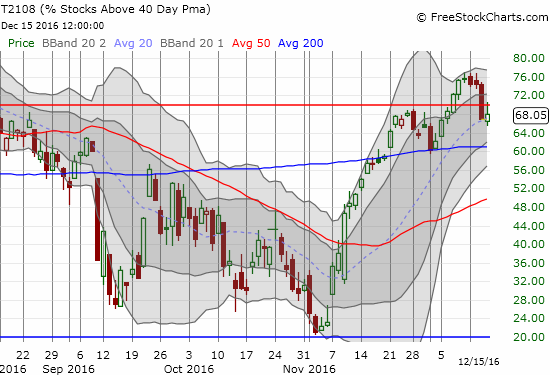
T2108, the percentage of stocks trading above their respective 40-day moving averages (DMAs), briefly returned to overbought conditions before the fade. This rejection adds a little more fodder to the bearish case newly staring down the stock market.
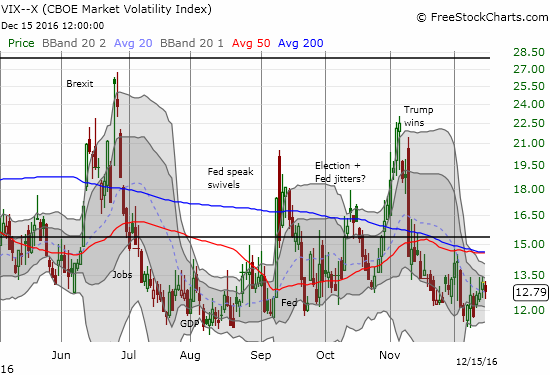
The small success of the sellers did not cause much concern in the stock market as the volatility index, the VIX, dropped for the first time in 3 days. I will call the small decline the expected post-Fed fade of volatility.
The bearish case remains subtle, but the selling in homebuilders caught my immediate attention. Just ahead of the Fed, I sold my call options on iShares US Home Construction (ITB) as a precaution and locked in my gains. I am quite relieved I took the precautions. ITB rallied after the release of the Housing Market Index (HMI), but sellers returned with such ferocity that ITB closed with a 1.3% loss. ITB is now suffering stark underperformance just when it is supposed to experience seasonal outperformance.
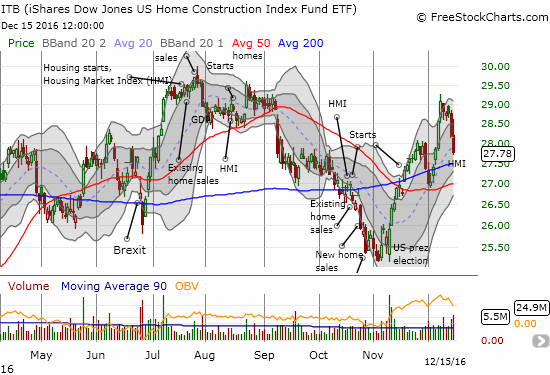
Given I do not think the Fed’s move was particularly hawkish or damaging, I remain focused on the next buying opportunity in ITB. At some point I will buy the dip again independent of my short-term trading call. (For background on my bullishness on housing, see my latest “Housing Market Review.”)
Lastly, the U.S. dollar index (DXY0) continued its surge. The dollar is definitely back in “full bull” mode with a breakout to a 14-year high. It is time for me to get back onboard after having unloaded most of my dollar longs ahead of the Fed as a matter of precaution; I was half-expecting a “sell the news” response to the Fed’s rate hike.
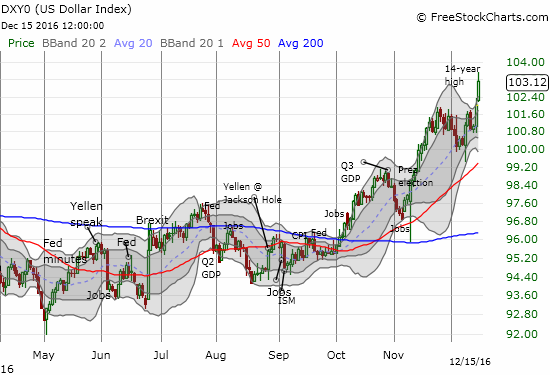
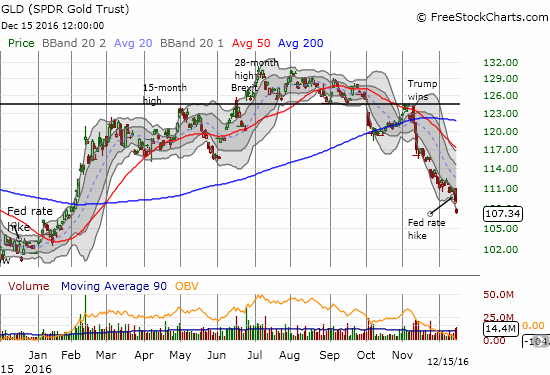
The bottom-line: I think the case for the bears got incrementally stronger today from a technical standpoint. Surprisingly, we are yet to see the market worry much about the implications of a scorching hot U.S. dollar. Accordingly, I decided to take another bearish step by loading up on shares of ProShares UltraShort S&P500 (SDS). I avoided put options in anticipation of what I THINK should be a relatively benign holiday trading period. The Apple (AAPL) put options I bought yesterday are likely going down in flames, but I reloaded with an expiration of next Friday. For a twist, I added to some call options on commodity plays in case the market goes back to rotating them upward. While a strong U.S. dollar should be a strong negative, a whole host of commodity plays have rallied in spite of dollar strength.
— – —
FOLLOW Dr. Duru’s commentary on financial markets via email, StockTwits, Twitter, and even Instagram!
Daily T2108 vs the S&P 500

Black line: T2108 (measured on the right); Green line: S&P 500 (for comparative purposes)
Red line: T2108 Overbought (70%); Blue line: T2108 Oversold (20%)
Weekly T2108

*All charts created using freestockcharts.com unless otherwise stated
The charts above are the my LATEST updates independent of the date of this given T2108 post. For my latest T2108 post click here.
Related links:
The T2108 Resource Page
Be careful out there!
Full disclosure: long AAPL puts, mixed positions on the U.S. dollar (probably time to get net long again?!?!), long GLD
