
(T2108 measures the percentage of stocks trading above their respective 40-day moving averages [DMAs]. It helps to identify extremes in market sentiment that are likely to reverse. To learn more about it, see my T2108 Resource Page. You can follow real-time T2108 commentary on twitter using the #T2108 hashtag. T2108-related trades and other trades are occasionally posted on twitter using the #120trade hashtag. T2107 measures the percentage of stocks trading above their respective 200DMAs)
T2108 Status: 74.5% (5th overbought day)
T2107 Status: 67.1%
VIX Status: 12.7
General (Short-term) Trading Call: cautiously bullish
Active T2108 periods: Day #205 over 20%, Day #25 over 30%, Day #24 over 40%, Day #22 over 50%, Day #16 over 60%, Day #5 over 70% (overbought)
Commentary
This is day #5 of the (extended) overbought rally that I heralded last week. It is December Fed Eve: the December day before the Federal Reserve hands down its latest pronouncement on monetary policy. This policy statement will almost certainly include a rate hike and some hints as to the Fed’s thinking for 2017. In a move that speaks volumes about the surging optimism in financial markets, investors and traders rushed to put yet more money in stocks and send the major indices to fresh all-time highs.
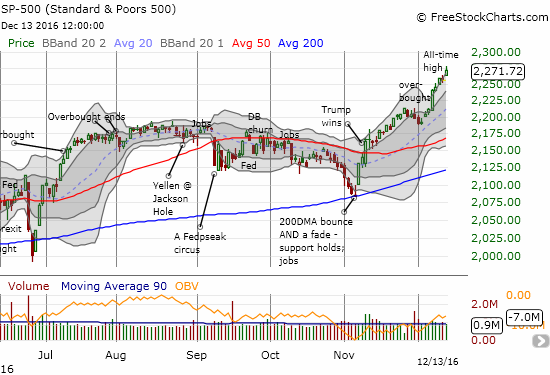
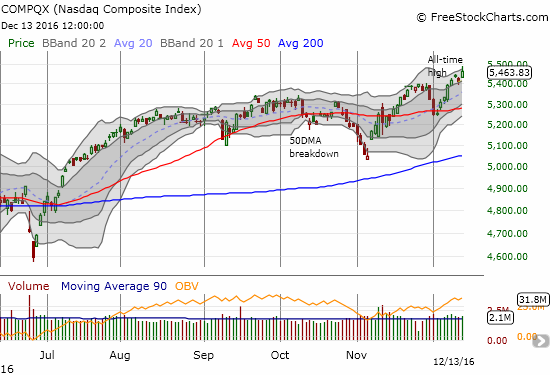
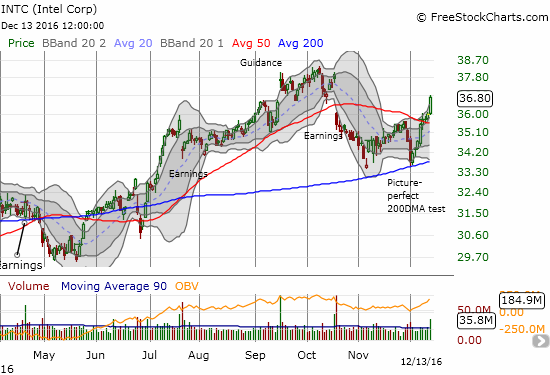
The S&P 500 (SPY) has created the very definition of an extended overbought rally by stretching to or above its upper-Bollinger Band for every day of this overbought period. The money rotation out of and back into tech stocks is abating now that the NASDAQ has joined the S&P 500 in printing all-time highs. Several big cap tech stocks notched notable gains on the day: Amazon.com (AMZN) 1.8%, Facebook (FB) 2.2% (despite today’s gain, Facebook still looks like it is breaking down), Apple (AAPL) 1.7%, and Intel (INTC) 2.3% stood out in particular. I REALLY like the 50DMA breakout on INTC. While I missed playing the perfect test of 200DMA support, I am looking forward to buying the dip.
With these gains, I expected T2108, the percentage of stocks trading above their respective 40-day moving averages (DMAs), to press further into overbought territory. I found instead that my favorite technical indicator is whispering warnings for financial markets. For the thrid day in a row, T2108 has gone nowhere even as the S&P 500 has advanced two of these of three days. I find this bearish divergence particularly troubling ahead of the Federal Reserve’s meeting. This divergence represents a market hesitation and underlying weakening that is hidden by the bigger stocks that must be leading the advance in the major indices.
Given this stall in T2108 I looked around at some usual suspects for more evidence. The iShares Russell 2000 (IWM) closed flat for the day and printed a technical pattern called a spinning top on Friday. Monday was a down day. Financial Select Sector SPDR ETF (XLF) closed with a paltry 0.3% gain and has gone nowhere for three days. SPDR S&P Retail ETF (XRT) closed flat on the day and sold off the previous two days from a 16-month high. The iShares Transportation Average (IYT) closed with a 0.3% gain and topped out three trading days ago. In other words, do not let the major indices fool you: the underlying market has paused and given the Fed meeting its due respect.
The volatility index, the VIX, has also paid its respects by increasing ever so slightly and gaining 4 out of the last 5 trading days after its last bottom.
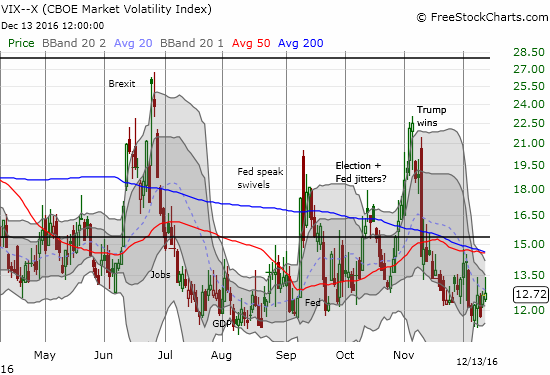
The VIX is too low for me to bother fading volatility ahead of the Fed meeting as I like to do, but I stand ready to fade post-Fed volatility.
The bearish divergence and the market hesitation convinced me to downgrade my short-term trading call to cautiously bullish. As a reminder of the T2108 trading rules on overbought conditions, I do not switch to bearish UNTIL T2108 drops out of overbought conditions or the S&P 500 goes parabolic and forms a climactic topping pattern. In other words, I am NOT bearish even as strain to listen to the whispering warning from T2108. As a small precaution, I will sell my shares in ProShares Ultra S&P500 (SSO) ahead of the Fed announcement. I was disappointed that the S&P 500 never dipped in the overbought period and forced me to just jump in and buy; as a result I am sitting on a small gain. I will also lock in my surprisingly large gains in my April call options on iShares US Home Construction (ITB).
As an example of my on-going bullishness, I went ahead and bought the big dips today in the commodity and industrial plays that have become extremely popular in this post-election rally. I am also preparing to buy any immediate post-Fed dips. I bought handfuls of call options in U.S. Steel (X), Cliffs Natural Resources (CLF), and Freeport-McMoran (FCX). X is 6.6% off its most recent high. CLF is down 11.2% off its most recent high and closed at 20DMA support. FCX is down 7.2% below its most recent high and has completely reversed the one-day surge that took the stock to that high. My positions in CLF and FCX are my second go-rounds in this post-election period.
(For the most recent background on my general bullishness, see “A Stock Market Positioned to Win A Battle of Sentiments: Taxation Versus Economic Optimism.”)
— – —
FOLLOW Dr. Duru’s commentary on financial markets via email, StockTwits, Twitter, and even Instagram!
Daily T2108 vs the S&P 500
")
Black line: T2108 (measured on the right); Green line: S&P 500 (for comparative purposes)
Red line: T2108 Overbought (70%); Blue line: T2108 Oversold (20%)
Weekly T2108

*All charts created using freestockcharts.com unless otherwise stated
The charts above are the my LATEST updates independent of the date of this given T2108 post. For my latest T2108 post click here.
Related links:
The T2108 Resource Page
Be careful out there!
Full disclosure: long SSO shares