
(T2108 measures the percentage of stocks trading above their respective 40-day moving averages [DMAs]. It helps to identify extremes in market sentiment that are likely to reverse. To learn more about it, see my T2108 Resource Page. You can follow real-time T2108 commentary on twitter using the #T2108 hashtag. T2108-related trades and other trades are occasionally posted on twitter using the #120trade hashtag. T2107 measures the percentage of stocks trading above their respective 200DMAs)
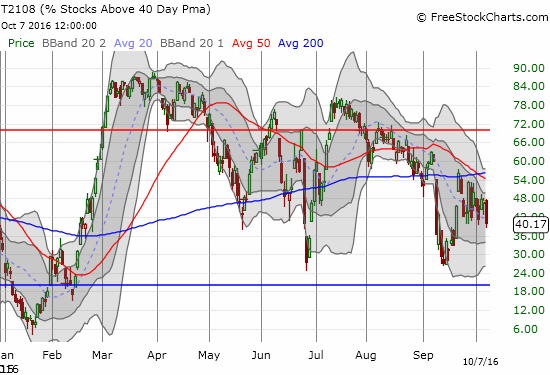
T2108 Status: 40.2%
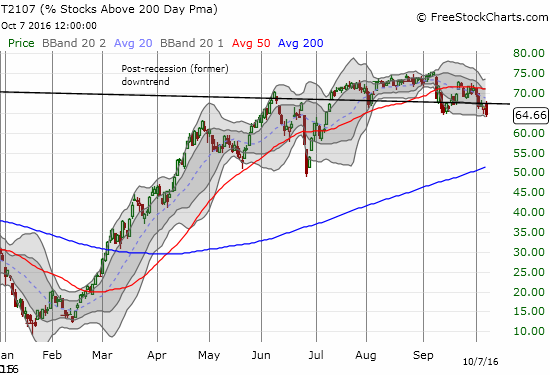
T2107 Status: 64.7%
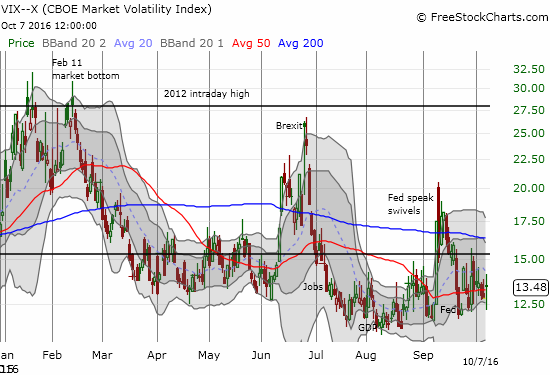
VIX Status: 13.5
General (Short-term) Trading Call: neutral
Active T2108 periods: Day #161 over 20%, Day #17 over 30%, Day #11 over 40% (overperiod), Day #5 under 50% (underperiod), Day #21 under 60%, Day #47 under 70%
Commentary
With the U.S. jobs report for September in the rearview mirror, the stock market looks forward to the next earnings cycle. The S&P 500 (SPY) comes into this season in a deceptively calm state. Since FedSpeak from Fed Head Rosengren knocked the index below its 50-day moving average (DMA) support, the S&P 500 (SPY) has spent just two days with a close above the 50DMA. The churn over this period as held the post-Rosengren low and hugged the 50DMA particularly closely in the past week.
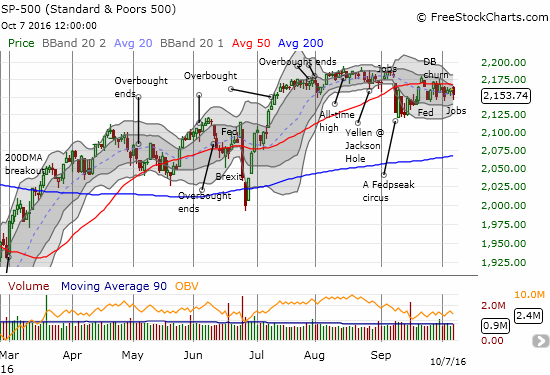
In the past week, I finally got the point and started fading the S&P 500 on rallies close to 50DMA resistance with put options that I either flipped the same day or the next day. T2108, the percentage of stocks trading above their respective 40DMAs, AND T2107, the percentage of stocks trading above their respective 200DMAs, reveal more underlying weakness than the index does: the apparent stalemate in the index is a bit deceptive. Since peaking on September 22nd, T2108 has slowly but surely carved out new (marginal) lows. Perhaps more importantly, T2107 is losing altitude with a fresh three-month low.
While the S&P 500 has churned, the volatility index has been unable to break above the 15.35 pivot line. However, anytime I see the VIX consolidating at or around low levels, like now, I ASSUME a launch is imminent.
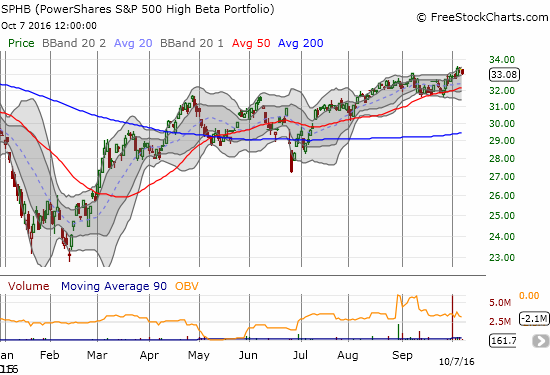
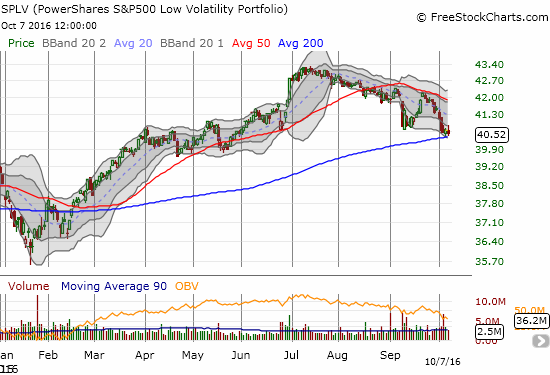
Another interesting feature of the S&P 500’s deceptive churn is the continued divergence between PowerShares S&P 500 High Beta ETF (SPHB) and PowerShares S&P 500 Low Volatility ETF (SPLV). SPLV is sliding down a trend in place since the July peak. SPHB is continuing along an uptrend. SPHB even hit a new high for 2016 last week. I am even more convinced that this divergence is unsustainable given the combination of T2107, T2108, and the VIX as shown above. If I am correct, convergence will resolve to the downside for the S&P 500. Note that I am keeping the short-term trading call at neutral until sellers actually prove they can follow-through on the bearish signals.
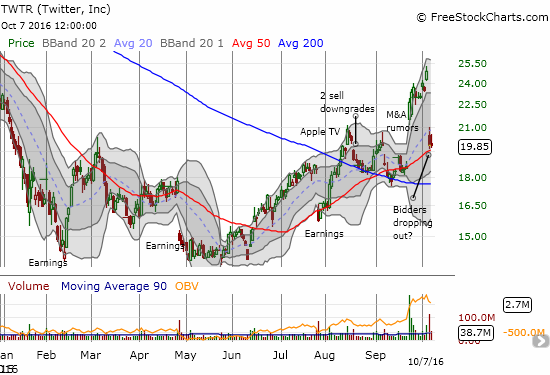
I could post a LOT of fascinating charts of individual stocks, but I will hold off for a bit longer with earnings season around the corner. My one exception for this post is Twitter (TWTR). I may have gotten a bit greedy by failing to lock in my profits on my short put. I was just glibly waiting for the final news of the (presumed) bidding process for the company. That strategy failed in spectacular fashion as rumors turned to companies getting cold feet. Still, I decided to add to my position by going long some (now much cheaper) call options in anticipation of TWTR holding support at its uptrending 50DMA. Gulp…
Finally see “Gold And Silver Bid For A Bottom” for my article explaining my latest trades on gold and silver.
— – —
FOLLOW Dr. Duru’s commentary on financial markets via email, StockTwits, Twitter, and even Instagram!
Daily T2108 vs the S&P 500
")
Black line: T2108 (measured on the right); Green line: S&P 500 (for comparative purposes)
Red line: T2108 Overbought (70%); Blue line: T2108 Oversold (20%)
Weekly T2108

*All charts created using freestockcharts.com unless otherwise stated
The charts above are the my LATEST updates independent of the date of this given T2108 post. For my latest T2108 post click here.
Related links:
The T2108 Resource Page
Be careful out there!
Full disclosure: long SDS, long UVXY shares, long TWTR calls, short TWTR put