(This is an excerpt from an article I originally published on Seeking Alpha on August 8, 2016. Click here to read the entire piece.)
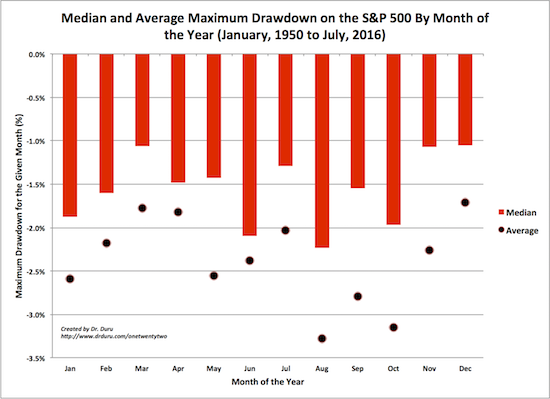
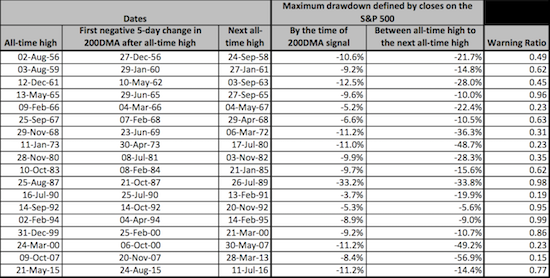
Almost a year ago, I wrote about an interesting signal that tends to accompany a significant top in the S&P 500 (SPY) – “significant” meaning preceding a sell-off of 10% or more. When the 200-day moving average (DMA) experiences a negative 5-day change, the uptrend stalls out and the index tops out. I called the related signal the “200-DMA post-peak correction signal.” Now that the S&P 500 is hitting all-time highs again after 14-month drought, I am on watch for this signal. I am particularly interested in tracking this signal because the trading calendar has entered the most important season for market drawdowns. {snip}

Source for price data: Yahoo Finance
{snip}
In other words, last year’s triggering of the 200-DMA post-peak correction signal was a good buying opportunity for long-term investors. Shorter-term traders could look forward to the prospect for deeper selling before the next bottom occurred.
{snip}

Source for price data: Yahoo Finance
While my interpretation of the 200-DMA signal worked out this time around, it did not (and could not) suggest how many lows would yet occur before the S&P 500 found the final bottom that would subsequently lead to the next all-time high. However, it did suggest that the bounces form the August low and even the January low were not likely the final post-peak bottoms. Now that another post-peak cycle is behind us, I have learned a little better how to use this indicator. {snip}
{snip}
The most notable characteristic of the current all-time high cycle that sets it apart from others is monetary policy. {snip}

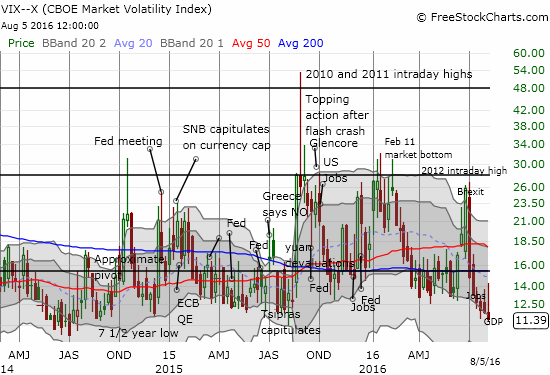
Since volatility tends to bounce off current levels, I am particularly sensitive to signs of topping behavior…even ahead of the post-peak signal triggering. {snip}
{snip}
Be careful out there!
Full disclosure: long SDS shares and SSO put options, long UVXY shares
(This is an excerpt from an article I originally published on Seeking Alpha on August 8, 2016. Click here to read the entire piece.)
