
The last Housing Market Review covered data reported in August for July, 2016. New home sales soaring to a fresh post-recession high made the big headline even as sentiment among home builders remained essentially flatline for the year. This time around, new home sales cooled off month-over-month as builder sentiment finally showed life with a near 1-year high. Last month I took the West out the doghouse. The West managed to stay out the doghouse for August’s data, especially with the region leading the way for new home sales and home builder sentiment. Existing home sales continued the more dour tone as an interesting contrast to all the other good news in the housing market.
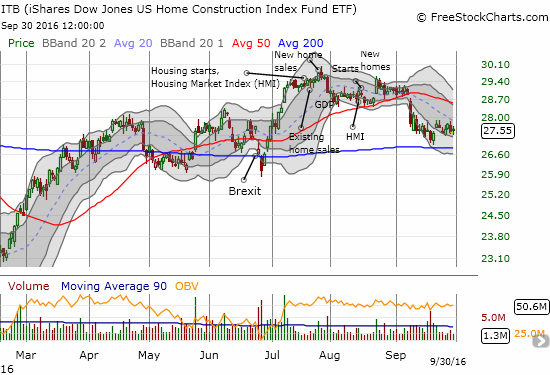
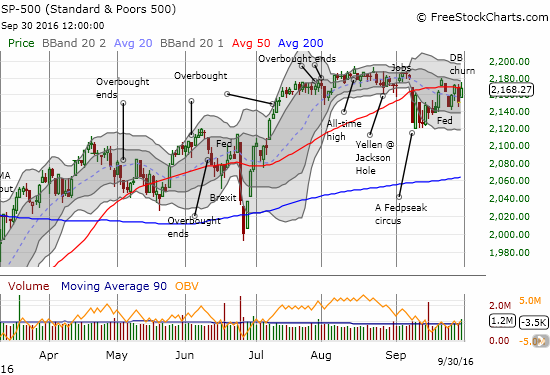
On net, iShares US Home Construction (ITB) ended September with a 5.1% loss. This decline is somewhat surprising given the S&P 500 (SPY) managed to close out the month essentially unchanged. The key difference in performance comes from the S&P 500’s ability to recover quickly from investor hand-wringing over FedSpeak. ITB has yet to show much life since that big down day.
New Residential Construction (Housing Starts) – August, 2016
Suddenly, the string of “boring” reports on housing starts ended…and not in a good way. Privately owned housing starts for 1-unit structures came in at 722,000 for August. The July 1-unit starts were revised downward to 768,000 from 770,000. This was the fourth month in a row of downward revisions. The month-over-month change was a loss of 6.0%. The year-over-year decline was 1.2%, a further downshift from June’s robust 16.0% year-over-year leap.
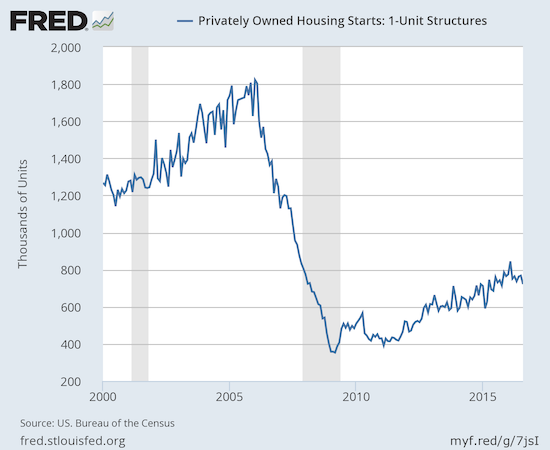
Source: US. Bureau of the Census, Privately Owned Housing Starts: 1-Unit Structures [HOUST1F], retrieved from FRED, Federal Reserve Bank of St. Louis, September 20, 2016.
The Northeast and the South regions drove the month-over-month and year-over-year declines. The Midwest and the West did exactly the opposite with month-over-month and year-over-year GAINS. These numbers present quite a dichotomy and suggest the overall declines may not be as bad as they appear on the surface. The South was the one region in the previous month that registered a year-over-year gain (10.0%), and by itself prevented the overall housing start change from going negative. The West is playing catch-up from losses in two of the previous three months with a whopping 6.3% gain from July and 29.2% from August, 2015.
Existing Home Sales – August, 2016
July ended a four-month streak of gains for existing home sales and represented the first year-over-year decline since November, 2015 and only the second such decline in the last 21 months. August delivered another monthly decline, but resumed (marginally) the year-over-year gains. The seasonally adjusted annualized sales of 5.33M were down 0.9% month-over-month from a downwardly revised 5.38M in sales for July. Year-over-year saw a gain of 0.8%. This decline is still a blip compared to current volatility given June’s sales hit a 9-year high.
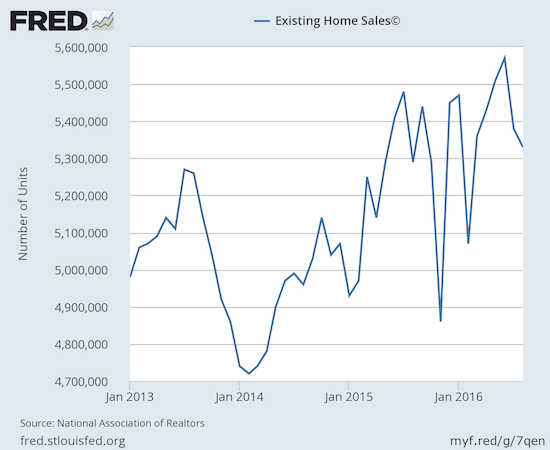
Source: National Association of Realtors, Existing Home Sales© [EXHOSLUSM495S], retrieved from FRED, Federal Reserve Bank of St. Louis, September 25, 2016.
Ironically, while the National Association of Home Builders (NAHB) heralded rising household incomes as a driver of “more serious buyers,” the NAR worried that these same incomes are NOT translating into sales of existing homes.
“While recent data from the U.S. Census Bureau shows that household incomes rose strongly last year, home prices are still outpacing incomes in many metro areas because of the persistent shortage of new and existing homes for sale. Without more supply, the U.S. homeownership rate will remain near 50-year lows.”
The NAR sounded relatively alarmed after July’s large monthly drop. The alarm stayed at a high level for the August numbers. Limited inventory remains the core problem:
“Healthy labor markets in most the country should be creating a sustained demand for home purchases..However, there’s no question that after peaking in June, sales in a majority of the country have inched backwards because inventory isn’t picking up to tame price growth and replace what’s being quickly sold.”
The August numbers showed that the inventory problem actually worsened. Housing inventory decreased year-over-year yet again. The year-over-year decline for August was a whopping 10.1% to 2.04M homes. Inventory has now declined year-over-year for 15 straight months. Months of inventory marginally decreased from 4.7 to 4.6 months of supply. Sellers remain hard to find relative to the presumed demand for homes.
On September 29, Nightly Business Report shed more light on how shriveling inventory is causing the housing market to cool down “a bit.” In the video below, cue to the 10:45 mark. The segment includes a brief interview with NAR’s Chief Economist and concludes with the advice: “if you want to move, move quickly.”
In the press conference, the NAR lamented that the housing numbers suggest a hollowing out of the middle class. Housing wealth is at a record high $6 trillion yet there are fewer homeowners. Although it is the rate of home ownership that sits at a 50-year low, presumably the housing wealth is shared across fewer people. The NAR anticipates that home builders will play a role in generating more inventory, but of course such gains will not show up quickly in the existing home sales data.
In last month’s report, the NAR cited an increasing problem with appraisal-related contract issues that delayed sales. There was no such mention in the latest report.
Investors perked up again as a share of sales. In August that share rose to 13% from 11% in July. As context, recall July’s share was the lowest share since 9% in July, 2009. In February, investors bought 18% of existing homes which was the highest share since April, 2014. Accordingly, first-time buyers took a small step back with 31% of sales, down from 32% in July and last year August.
In May and June, the West was the only region in the country to experience year-over-year drops in exiting home sales. In July every region suffered year-over-year declines. In August, no region experienced a year-over-year decline: the Northeast was flat, the Midwest gained 0.8%, the South increased 0.9%, and the West climbed 0.8%. Overall, a pretty (surprisingly) uniform distribution of gains across the regions.
August’s 5.1% year-over-year increase in the median price of an existing home represents the 54th consecutive month of year-over-year increases. August’s median price across all housing types of $240,200 is the second monthly decline (July was $244,100) after June set an all-time record of $247,700.
In past reviews of existing home sales, I have failed to point out the stats on single-family homes. Single-family is my main focus in studying housing markets, so starting with this report I will include those specific numbers for existing home sales. Note that for August, single-family sales are doing better than overall sales:
“Single-family home sales declined 2.3 percent to a seasonally adjusted annual rate of 4.70 million in August from 4.81 million in July, but are still 0.6 percent above the 4.67 million pace a year ago. The median existing single-family home price was $242,200 in August, up 5.3 percent from August 2015.”
New Residential Sales – August, 2016
New home sales were the big headline last month as they soared to a fresh post-recession high. In the last Housing Market Review I noted that I did not expect the market to sustain the torrid pace of sales. I am still predicting this post-recession peak will not get challenged until the next Spring selling season. So, predictably, August’s new single-family home sales pulled back.
New single-family home sales hit 609,000 for August, marking a decrease of 7.6% from July’s revised 659,000 sales. Sales increased 20.6% year-over-year, a torrid pace that is slower than July’s 31.3% year-over-year gain and June’s 25.4% year-over-year increase.
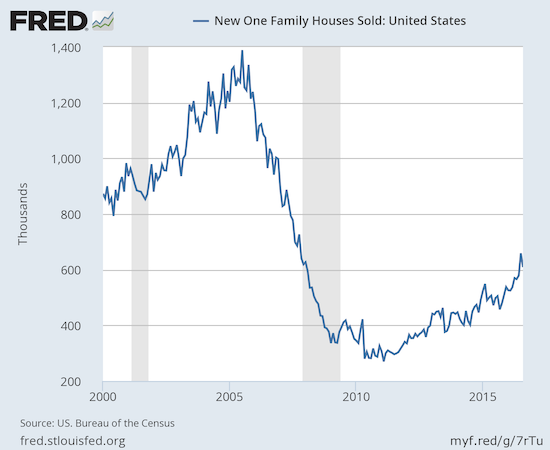
Source: US. Bureau of the Census, New One Family Houses Sold: United States [HSN1F], retrieved from FRED, Federal Reserve Bank of St. Louis, September 27, 2016.
With sales pulling back from July’s extreme, new home inventory increased form 4.3 months to 4.6. Inventory was 4.9 months in June.
The West went from consistent laggard to biggest bright spot in the new home sales report. In the 5 months prior to June, the West suffered year-over-year declines in sales. The West has had a robust summer with year-over-year sales increases of 24.6% (3rd ranked region), 11.4% (4th ranked region), and 35.0% (2nd ranked region), June through August respectively. The West’s August sales were also notable because it was the only region to log a month-over-month gain (8.0%). The Northeast was the only region to log a year-over-year loss (-25.8%).
Home Builder Confidence: The Housing Market Index– August, 2016
The Housing Market Index (HMI) started the year at 61 and then went four straight months at 58. In June, the HMI came to life again with a jump to 60 but dropped back to 58 for July. For August, the HMI was revised downward from 60 to 59 which makes September’s 65 reading look like an even stronger jump. HMI has gone from flatline in 2016 to scoring a post-recession high, matching the 65 from October, 2015. Home builder sentiment once again leads the way for housing data and suggests that at least housing starts will remain strong in the months to come.
All three components of the HMU helped push HMI higher. Even the “traffic of prospective buyers” returned to post-recession highs. The iShares US Home Construction (ITB) responded on the day with a gap up that went as high as a gain of 2.3% but closed the day with a 0.9% gain. Clearly, the market was not nearly as excited about the reading as I was.
Click for a larger view…
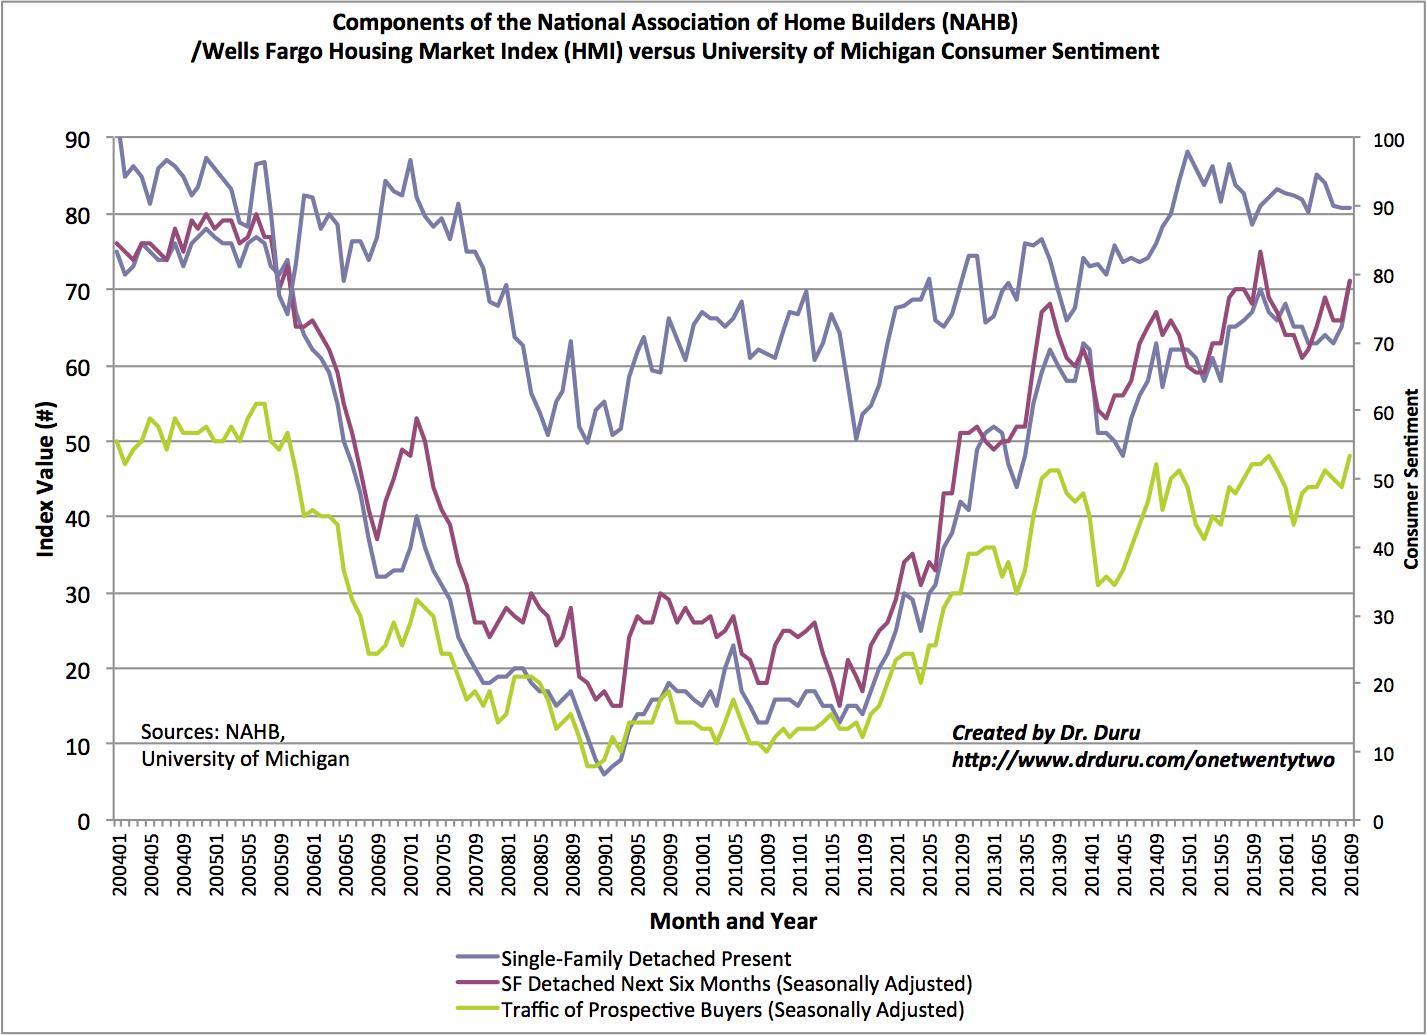
Source: The National Association of Home Builders (NAHB)
The NAHB was clearly excited about this breakout for HMI given the quotes the organization provided to explain what happened:
“As household incomes rise, builders in many markets across the nation are reporting they are seeing more serious buyers, a positive sign that the housing market continues to move forward…The single-family market continues to make gradual gains and we expect this upward momentum will build throughout the remainder of the year and into 2017.
With the inventory of new and existing homes remaining tight, builders are confident that if they can build more homes they can sell them…Though solid job creation and low interest rates are also fueling demand, builders continue to be hampered by supply-side constraints that include shortages of labor and lots.”
On a regional basis, the West has confirmed the trough I observed in the last Housing Market Review. Even more encouraging for the West: the region led the way for home builder sentiment with a four-point surge to 74. The Midwest stayed flat at 55 while the Northeast and South gained one point each. I am finally finished worrying about the health of the housing market in the West.
Parting thoughts
The stocks of home builders sit at a fascinating juncture. The overall housing market news remains strong but anticipation of a Fed rate hike is providing a clear weight on ITB. In the immediate wake of the big one-day decline on September 9, I decided to buy a fistful of call options on ITB although my earlier strategy was to wait until a sizable sell-off and/or November which is the typical start of the seasonally stronger period for home builders. ITB rallied in a move I thought marked a bottom. The next week, ITB tested support at its 200-day moving average (DMA), and I doubled down on the position. The call options expire in October, so the position is high-risk given October’s potential for a major pullback. I am calling it “pre-seasonal” speculation.
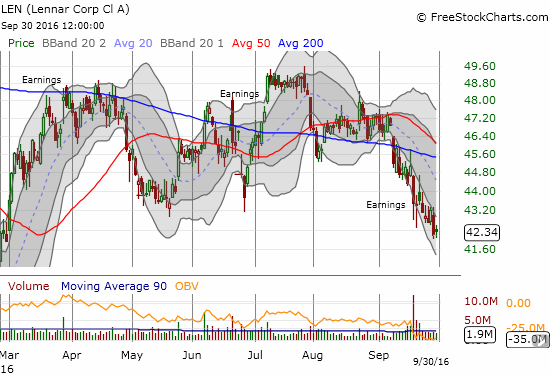
I also decided to speculate on a bounceback for Lennar Homes (LEN) as investors bailed on the stock post-earnings. That selling continues.
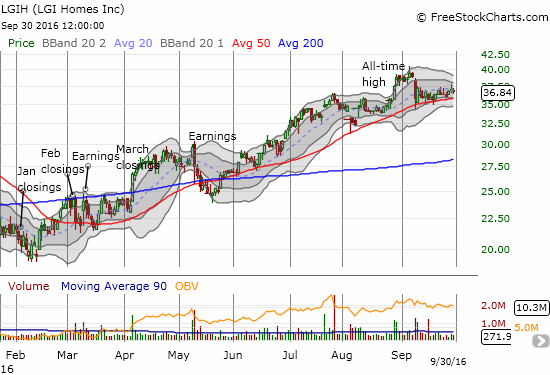
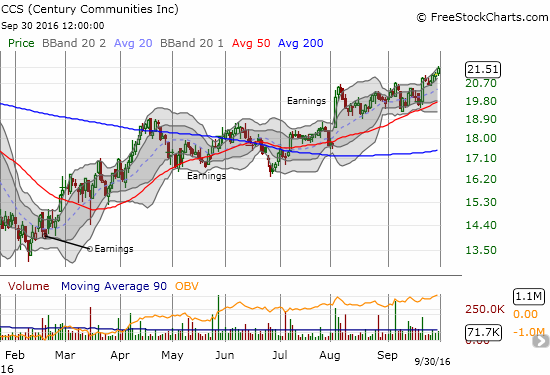
Most fascinating about this juncture is the diverging performance of big, diversified builders versus regionals. I have long favored the regional builders, and they are finally distinctly standing out. LGI Homes (LGIH) is back in the good graces of traders with a whopping 51% gain for 2016 and a recent all-time high. Century Communities (CCS) is up 21% year-to-date. CCS still has a ways to go to match 2015’s all-time high. These may be the first two individual builder stocks I go after in the event of a steep sell-off ahead November.
Be careful out there!
Full disclosure: long ITB and LEN call options