
The last Housing Market Review covered data reported in June, 2016 for May. At the time, the iShares US Home Construction ETF (ITB) had just reversed all its post-Brexit losses along with a sharp rebound in global financial markets. I expressed concern that ITB finally reached a top for the current cycle. The ETF instead went on to register a fresh 11-month high on the heels of relatively strong housing data.
The rally came to an abrupt end with Friday’s release of U.S. GDP for Q2 2016. The 1.2% year-over-year growth came in well below the 2.5% “expectations.” The main drag was a plunge in gross private domestic investment. Contributing to the decline was private residential investment which exerted a drag on GDP for the first time since Q1 of 2014. The index for private residential investment declined month-over-month for the first time in at least 2 1/2 years. On a year-over-year basis the index still gained 6.2%. Overall, the drag was a bit of a surprise given the relatively healthy housing data throughout most of 2016.
The selling in the shares of home builders in the wake of the GDP numbers has the markers of a top: high volume and following a strong fade from an intraday 11-month high. As a result I am likely to finally sell my ITB call options in the coming week even though I still have over two months to expiration.
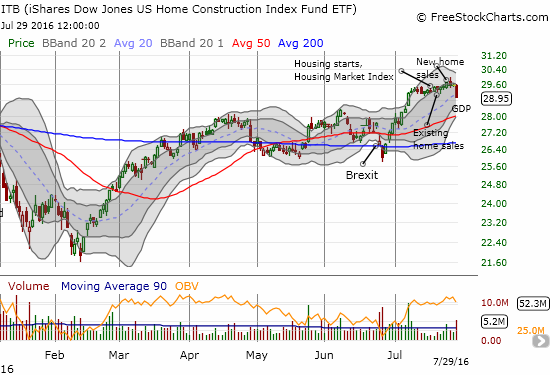
Source: FreeStockCharts.com
The 2.1% 1-day loss on ITB was made more dramatic by the ability of the S&P 500 (SPY) to GAIN 0.2% on the day despite the surprisingly weak GDP print. The index even traded to a marginal new intraday high before closing just under the all-time high. A remaining question is whether housing (ITB) under-performance will grow worse in due time or whether the general market will catch up.
New Residential Construction (Housing Starts) – June, 2016
Housing starts continued their stabilization since March’s large drop. Privately owned housing starts for 1-unit structures came in at 778,000 for June. The May 1-unit starts were revised downward to 745,000 from 764,000. This was the second month in a row of downward revisions. The month-over-month change was a gain of 4.4%. The year-over-year growth was a robust 16.0%, far exceeding May’s 10.1% year-over-year gain. The chart below shows the uptrend remains in place.
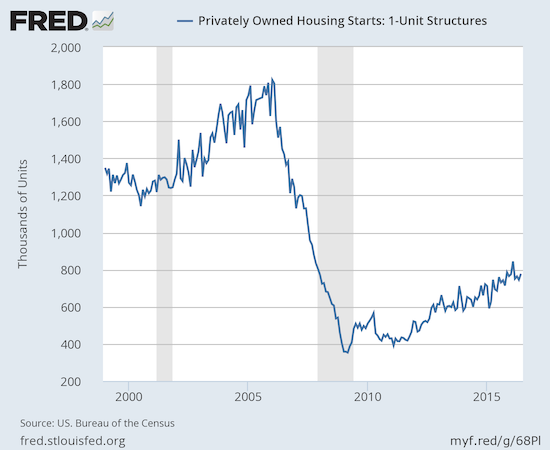
Source: US. Bureau of the Census, Privately Owned Housing Starts: 1-Unit Structures [HOUST1F], retrieved from FRED, Federal Reserve Bank of St. Louis, July 31, 2016.
The West ended 2 straight months of losses that contrasted with the total housing start numbers. Single unit starts in the West gained 3.1% from May and gained 7.7% year-over-year. Still, the West did not outshine the other regions. The South ended its streak of double-digit month-over-month gains with a paltry 0.5%, but the year-over-year increase was 7.2%. The Northeast and the Midwest soared with 74.4% and 20.4% year-over-year gains respectively.
Existing Home Sales – June, 2016
June delivered a fourth straight month of gains for existing home sales. The seasonally adjusted annualized sales of 5.57M are up 1.1% month-over-month and 3.0% year-over-year. Sales have not been this high in over 9 years (since February, 2007). There were two particular highlights of note. Despite the 9-year high in sales, investors were only responsible for 11% (down from 13% in May). This is the lowest share since 9% in July, 2009. Recall that just in February investors bought 18% of existing homes which was the highest share since April, 2014. Part of this month’s decline in investor share came from an encouraging increase in first-time homebuyers. First-timers purchased 33% of existing homes. This share was up from the 30% in May and the highest since 34% in July, 2012. The average for 2015 was 30%. In other words, BOTH the level and mix of existing sales are looking ever healthier.
The National Association of Realtors (NAR) applauded the strong results but worried as usual:
“Looking ahead, it’s unclear if this current sales pace can further accelerate as record high stock prices, near-record low mortgage rates and solid job gains face off against a dearth of homes available for sale and lofty home prices that keep advancing.”
For the second month in a row, the West was the only region in the country to experience a year-over-year drop in exiting home sales. While the West increased 1.7% form May, the region dropped 0.8% year-over-year. The median home price soared again, this time by 7.2% year-over-year. This increase exceeded all other regions despite their much better sales profiles. Per the NAR’s concerns, the pace of sales in the West is likely to slow further and to help pull down overall sales.
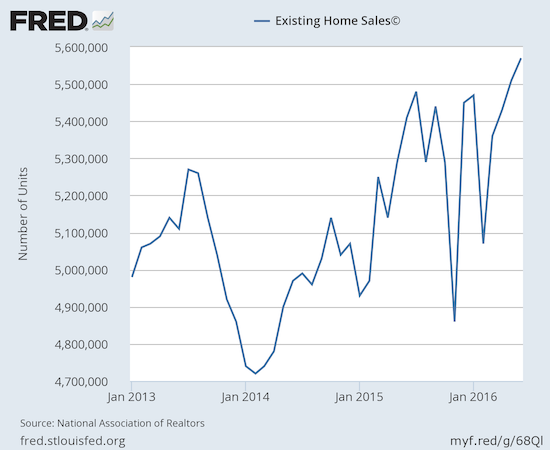
Source: National Association of Realtors, Existing Home Sales© [EXHOSLUSM495S], retrieved from FRED, Federal Reserve Bank of St. Louis, July 31, 2016.
Housing inventory decreased year-over-year again. This time the year-over-year decline was 5.8% to 2.12M. Over the last four months, inventory has had greater year-over-year drops. Months of inventory declined from 4.7 to 4.6 months of supply. This level remains far short of the 6 months typically indicative of a balanced market. Forty-eight percent (48%) of homes sold in June were on the market for under a month. This level is down from 49% in May which was the highest percentage since tracking began in 2011. The fast pace of sales continues to help prices push upward.
June’s 4.8% year-over-year increase in the median price of an existing home represents the 52nd consecutive month of year-over-year increases. June’s median price across all housing types of $247,700 sets another record for existing home sales. This record was set in June, 2016 and before that in June, 2015.
New Residential Sales – June, 2016
New home sales resumed their streak to new post-recession heights.
New single-family home sales for June increased 3.5% above May’s level and soared 25.4% year-over-year. The 592,000 new homes sold maintains the current uptrend that started in 2011 and resumes the setting of new post-recession highs.
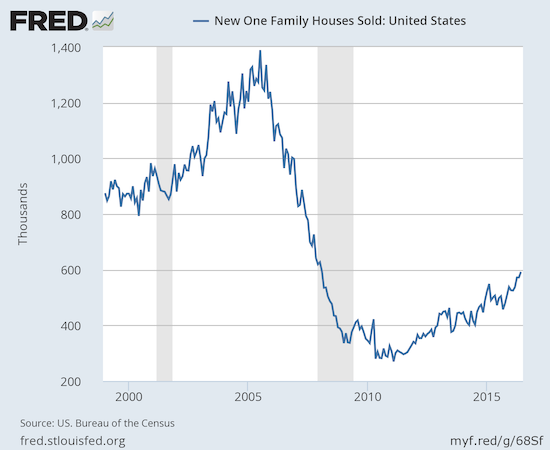
Source: US. Bureau of the Census, New One Family Houses Sold: United States [HSN1F], retrieved from FRED, Federal Reserve Bank of St. Louis, July 31, 2016.
New home inventory sank from 5.3 to 4.9 months from May to June. This was a 6.0% gain from May, 2015. Inventory sat at 5.8 months in February and March of 2016 which refutes my notion that April’s 4.7 moths was an aberration. With sales soaring again and starts staying at stable levels, this inventory imbalance could actually worsen in coming months.
June’s new home sales delivered relief for the West. In the previous 5 months, the West had suffered year-over-year decline in sales. For June, sales in the West soared 24.6% year-over-year. However, like existing home sales, these numbers were strong in the absolute but not impressive when compared to the other three regions. The Northeast, the Midwest, and the South registered year-over-year gains of 30.8%, 44.1%, and 21.1% respectively. The West edged out the South to avoid a last place finish.
Home Builder Confidence: The Housing Market Index– July, 2016
The Housing Market Index (HMI) started the year at 61 and then went four straight months at 58. In June, the HMI came to life again with a jump to 60. For July, HMI dropped slightly to 59. With an overall average of 59 for 2016, the HMI is essentially going nowhere. The individual components remain the real story. For July, the sentiment regarding future sales, “SF detached next six months,” notably reversed most of its sharp gains from May to June. This reversal may signal the quick resolution of a surprising divergence from sentiment over current sales. The two sentiments are typically closely correlated.
This sharp dip for sentiment on future sales may also confirm the end of the run for ITB.
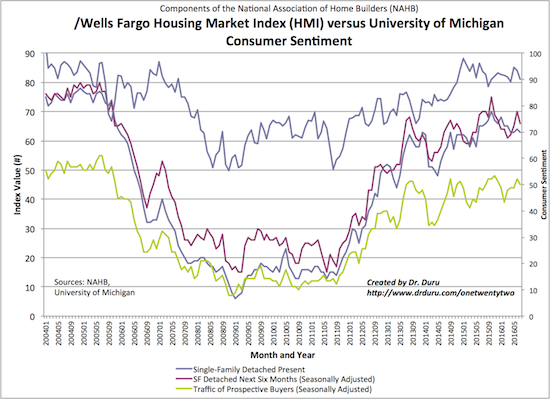
Source: The National Association of Home Builders (NAHB)
For July, the West, surprisingly enough, was the only region to register a gain in HMI. The other three regions remained flat with June’s levels. This was the West’s second 1-point monthly gain in a row. I am surprised that sentiment for the West has diverged so notably from the cooling data in the region. Perhaps this divergence signals a trough for the West’s performance.
Parting thoughts
My “no regret” position in ITB was doing quite well until Friday’s weak GDP report knocked off about half my profits. As I noted, I am taking this sharp fall from highs as a signal of a (short-term?) top. I remain interested in buying dips. For ITB, a buyable dip would mean a tumble at least to support at its 50-day moving average (DMA) and more likely to its 200DMA.
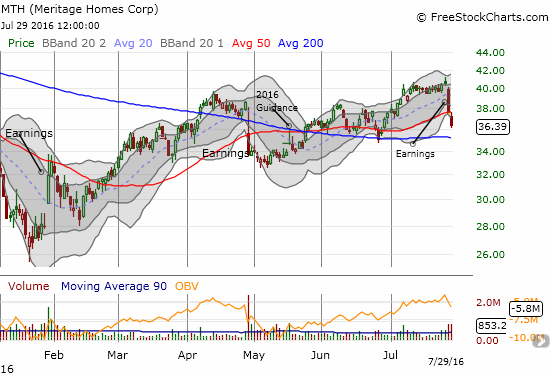
I also need to catch up on the recent spate of earnings in individual home builders to look for case-specific opportunities. At the top of my list is Meritage Homes (MTH). In mid-May, I claimed that MTH gave strong and encouraging guidance “too late.” The stock went on to gain another 18.5% before earnings brought the rally to a screeching halt. MTH tumbled 7.4% after guiding below expectations for Q3. Friday’s follow-up selling in sympathy with ITB has pretty much nailed a top for MTH. It seems my suspicion about MTH’s guidance may have been the right call but in the wrong place.
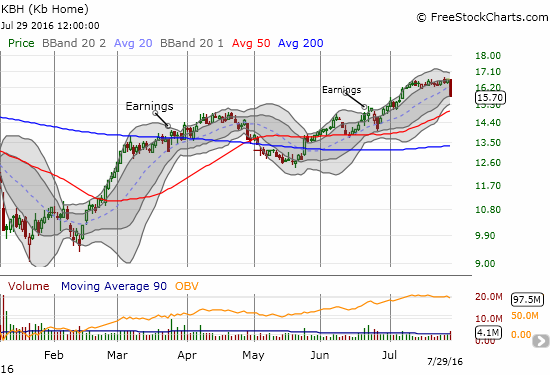
The housing data remain relatively strong. It was a bit of a relief to see the weak streak for the West start to abate, but the West is not out of the woods even with the intriguing divergence in HMI for the West. I will look for further clues in earnings reports. For example, I am way behind in reviewing the June report from KB Home (KBH) which could provide just the info I want on the West. Note in the chart that the market responded OK to the report until Brexit delivered a momentary hiccup. From a technical perspective I should have bought back in on the new high following earnings (this miss is part of a bunch of post-Brexit misses I made!). Friday’s high-volume, 5.5% loss has of course ended my interest in chasing the stock higher. I am back to looking for an opportune dip.
Source: FreeStockCharts.com
It is still possible that the market will reverse course after a closer look at GDP or perhaps upon future revisions. The decline in private residential investment contrasts sharply enough with the recent data on single-family housing that I suspect that the real issue is multi-family housing. If so, home builder shares could, slowly but surely, reverse the GDP-related losses for a nice swing trade for the nimble. Time will tell on THAT scenario.
For now, I am officially in wait and see mode on home builders. I am more interested in studying the earnings results than in trading the stocks right now. In another 3 to 4 months, the seasonal trade in home builders will start all over again, so I feel little pressure to jump back in right now. I am very interested in understanding more about the firming but still wobbly results in the West. I have added to my list resolving the contrast between GDP and the housing data in aggregate. Hopefully, I will have made progress by the next housing market review!
Be careful out there!
Full disclosure: long ITB call options