
(T2108 measures the percentage of stocks trading above their respective 40-day moving averages [DMAs]. It helps to identify extremes in market sentiment that are likely to reverse. To learn more about it, see my T2108 Resource Page. You can follow real-time T2108 commentary on twitter using the #T2108 hashtag. T2108-related trades and other trades are occasionally posted on twitter using the #120trade hashtag. T2107 measures the percentage of stocks trading above their respective 200DMAs)
T2108 Status: 53.1%
T2107 Status: 71.6%
VIX Status: 12.4
General (Short-term) Trading Call: neutral
Active T2108 periods: Day #154 over 20%, Day #10 over 30%, Day #4 over 40%, Day #1 over 50% (overperiod, ending 3 days under 50%), Day #14 under 60% (underperiod), Day #40 under 70%
Commentary
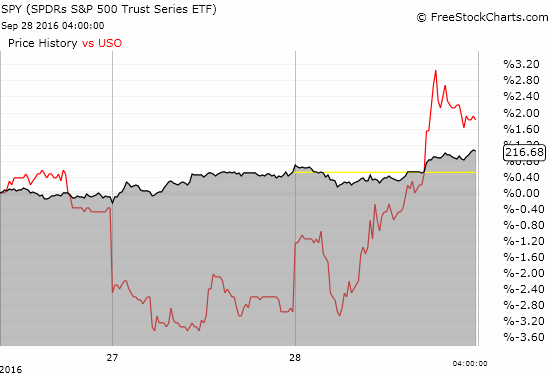
Gotta love it when the stock market celebrates that we'll be paying more for oil because of market manipulation. $USO $SPY $UGA
— Dr. Duru (@DrDuru) September 28, 2016
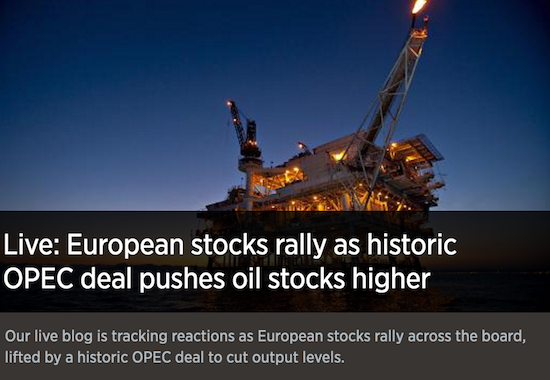
Correlations between the price of oil and the stock market have become an enduring mark on trading financial markets ever since oil started its price collapse in 2014. Yet, while the S&P 500 (SPY) maintained an ever so slight bias upward during the time of oil’s collapse, market commentary was most excited when oil and stocks moved in the same direction on a given day. The strong correlation returned with a vengeance on Wednesday, September 28, 2016 after headlines proclaimed that OPEC is finally ready to cut oil production. The cut will be OPEC’s first such production cut since 2008. I marveled at the quick trigger rally in the stock market on this news: a celebration of market manipulation and increased expenses for the average consumer. U.S. crude oil closed the day with a 5.1% gain while the S&P 500 gained 0.5% after initially trading lower.
The chart below comparing SPY versus United States Oil (USO) shows both the correlation and the caveats. On Tuesday, USO gapped down, and the S&P 500 rallied on the day anyway. The market almost reversed all the losses from Monday. On Wednesday morning, oil sold off on the heels of the latest EIA (Energy Information Administration) report on oil markets. However, someone must have received “the drop” because it was all rally from there. While USO rallied sharply, the S&P 500 wallowed in slightly negative territory. The OPEC news pushed the S&P 500 over the hump from flatline into the green: stocks took the ball and ran from there.
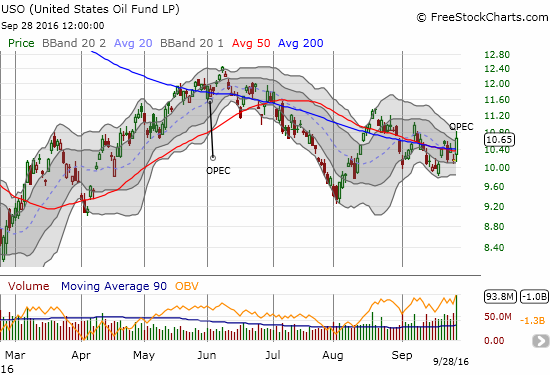
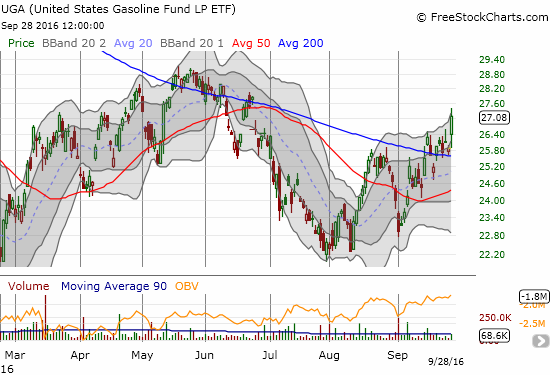
The surge in oil also threw my recent change in trading strategy for a loop. In “A Shift In the UGA vs USO Pairs Trade Ahead of Algiers OPEC Gathering,” I explained my rationale for taking profits on my shares in United States Gasoline (UGA) and leaving in place my put options on USO. Now, I am staring down the prospect of a sustained rally in oil. If USO manages to break out from the current short-term downtrend, I will indeed need to wheel my strategy back around to a pairs trade approach.
So the market quickly disciplined me as I tried to make a short-term forecast for oil prices. It was a convenient reminder of why I prefer non-directional bets on oil. Regardless, I do not feel so bad. Bulls and bears alike persistently take turns being incredibly wrong about the oil market. This time it was the turn of bulls to gloat over the mistakes of the bears….like this post I saw on StockTwits…
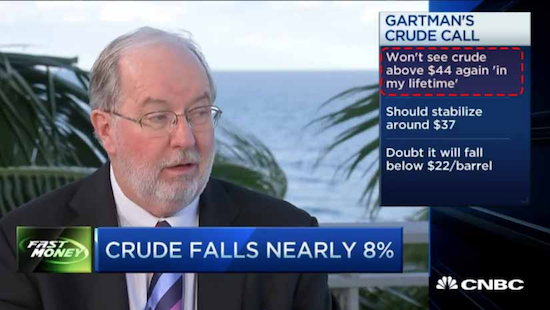
Source: StockTwits
I am guessing Gartman adjusted and re-adjusted his forecasts as oil’s collapse unfolded and then slowed and then bottomed. Still, such certainty and specificity are classic in the oil forecasting game.
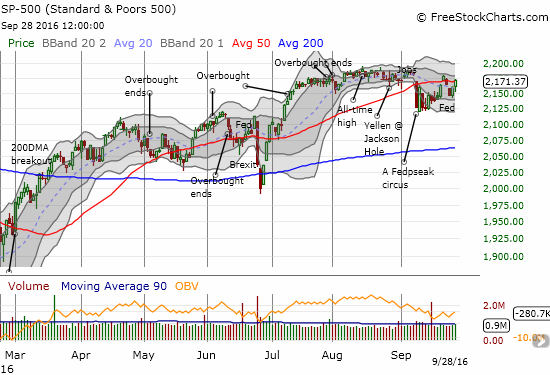
The S&P 500’s rally closed out just above 50DMA resistance. I am starting to suspect that, at best, the stock market is going to bounce, sometimes sharply, within a new trading range going into the U.S. Presidential election. The risks are probably more weighted to the downside.
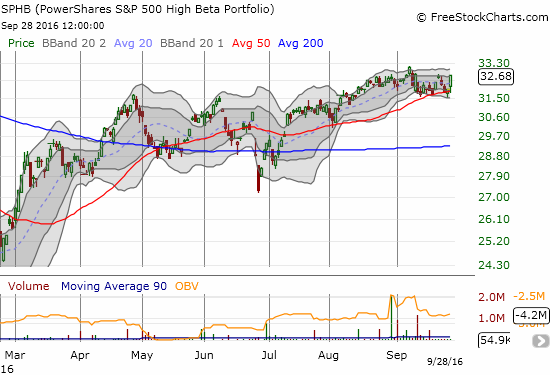
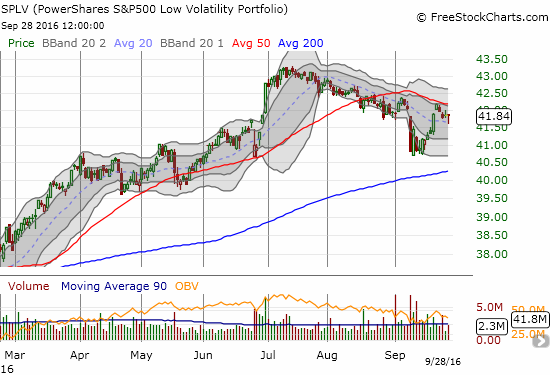
T2108 confirmed the bullishness of the trading by surging from 43.3% to 53.1%. Perhaps more interesting was the divergent behavior of PowerShares S&P 500 High Beta ETF (SPHB) which gained a robust 2.2% while PowerShares S&P 500 Low Volatility ETF (SPLV) end the day at flatline. In other words, the high beta, highest risk stocks in the S&P 500 led the entire charge higher.
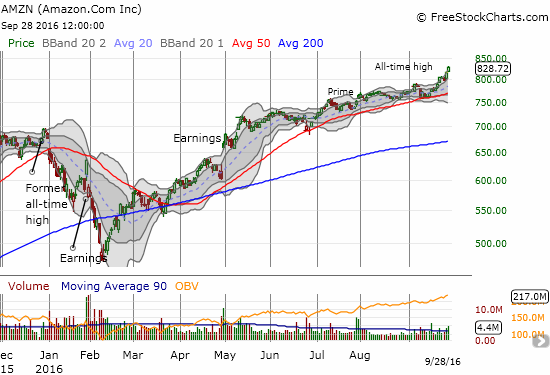
Amazon.com (AMZN) was probably the most notable of the high beta stocks leading the charge. AMZN is up 22.6% year-to-date and closed with a 1.6% gain on the day. AMZN printed another all-time high with a close perched well above the stock’s upper-Bollinger Band.
While high beta stocks look poised to leave low volatility stocks in the dust, the volatility index, the VIX, sank back to its “launching pad” in the 12 area.
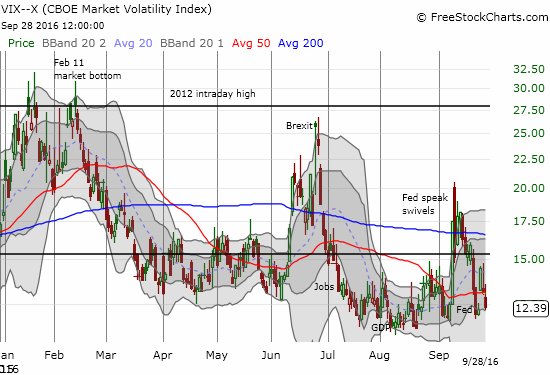
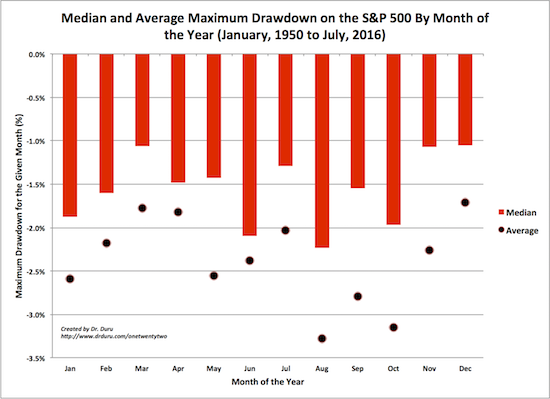
With volatility back to recent lows, the market is set up all over again for the next volatility spike. Can October finally deliver the big pullback that August and September failed to deliver? Dennis Gartman believes so. From CNBC…
“‘October is going to be, I think, a spooky month,’ the editor and publisher of The Gartman Letter told CNBC’s ‘Power Lunch.’
‘You have political circumstances, I think, that are going to make October an unbelievably volatile period of time. So, yes, you have earnings season beginning but I think it’s the politics that will trump it all.'” (Hey – was that an intended pun?!)
Source: CNBC
— – —
FOLLOW Dr. Duru’s commentary on financial markets via email, StockTwits, Twitter, and even Instagram!
Daily T2108 vs the S&P 500
")
Black line: T2108 (measured on the right); Green line: S&P 500 (for comparative purposes)
Red line: T2108 Overbought (70%); Blue line: T2108 Oversold (20%)
Weekly T2108

*All charts created using freestockcharts.com unless otherwise stated
The charts above are the my LATEST updates independent of the date of this given T2108 post. For my latest T2108 post click here.
Related links:
The T2108 Resource Page
Be careful out there!
Full disclosure: long SDS, long UVXY shares, short UVXY call options, in a hedged position on USO with pulls and calls,