(T2108 measures the percentage of stocks trading above their respective 40-day moving averages [DMAs]. It helps to identify extremes in market sentiment that are likely to reverse. To learn more about it, see my T2108 Resource Page. You can follow real-time T2108 commentary on twitter using the #T2108 hashtag. T2108-related trades and other trades are occasionally posted on twitter using the #120trade hashtag. T2107 measures the percentage of stocks trading above their respective 200DMAs)
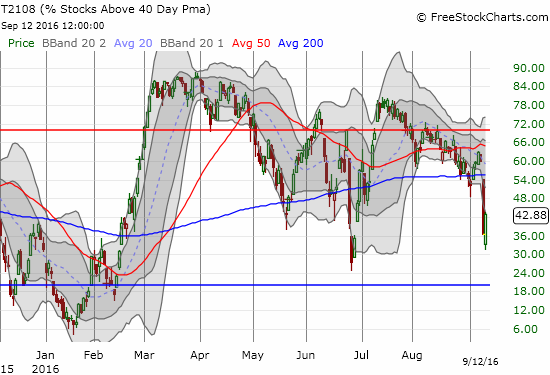
T2108 Status: 42.9% (as low as 31.2%)
T2107 Status: 71.8%
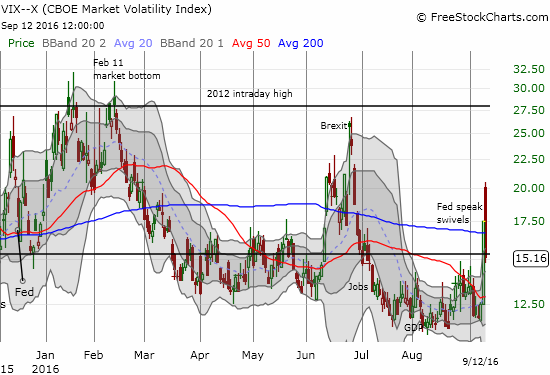
VIX Status: 15.2 (as high as 20.5 and a 17% gain from Friday’s close)
General (Short-term) Trading Call: neutral
Active T2108 periods: Day #144 over 20%, Day #50 over 30%, Day #1 over 40% (overperiod ending 1 day under 40%), Day #2 under 50%, Day #2 under 60%, Day #26 under 70%
Commentary
Ah. The soothing sounds of Fedspeak are back. Fedheads lining up today to remind us to stay calm. 🙂 $SPY #VIX back to 13 by end of week?
— Dr. Duru (@DrDuru) September 12, 2016
It was hard to guess how low would be low enough, but the stock market got to that point where the sellers completely exhausted their power of persuasion. In the last T2108 Update I outlined my expectations and conditions for a bounce. T2108, the percentage of stocks trading above their respective 40-day moving averages (DMAs), dropped as low as 31.2% before buyers rushed into the vacuum left behind by the sellers. As a reminder, when the market is in a bullish mood, T2108 around 30% has proven close enough to oversold to spark the next rally. Such was the case after Brexit, and buyers are clearly looking for a repeat performance here.

The volatility index, the VIX, had an even more dramatic day. The highs surprised me more than the lows given how the S&P 500 (SPY) was already so extended. At its high of the day, the VIX gained 17% from Friday’s close. That stretch alone had reversal written all over it. After the dust settled, the implosion of volatility was near complete. The VIX managed to close below the important 15.35 pivot point and may have signaled a very rapid return to the zone of complacency that dominated trading for the last two months.

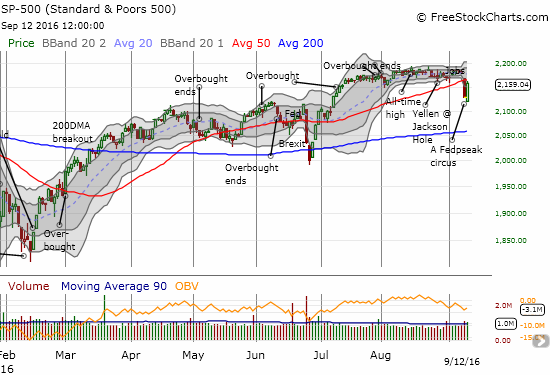
The only solace the bears could find on the day was the failure of the S&P 500 (SPY) to punch through resistance at its 50DMA. The buyers ran out of runway and settled for a 1.5% gain on the day.

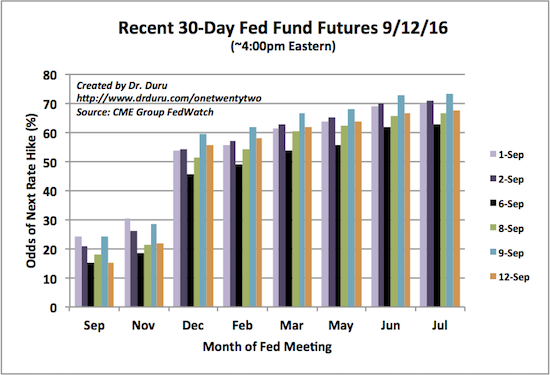
The technicals alone can explain the drama of the day. Yet, the story is much better with the fundamental backdrop of yet more Fedspeak. On Friday, the market panicked about the prospect of imminent rate hikes. In my last post, I explained the source of Boston Fed President Eric Rosengren’s optimism that ironically caused the market so much fear. Today, the market heaved a sigh of relief because two more FedHeads spoke and failed to lend support to Rosengren’s thesis of getting on with the business of rate hikes. Yet, after it was all said and done, expectations for the next Fed rate hike stayed in December. In fact, at 55.4% the odds are HIGHER than they were before Rosengren spooked the market.

Source: CME FedWatch Tool
The Fedspeak circus is getting oh so tiring, but we have to put up with it. The Federal Reserve as a group remains scared to death that too much action could cause a calamity. FedHeads are juggling competing data points. They are jumping through hoops of fire previously unseen. They are watching in trepidation and unease as financial markets fly high on the trapeze. They are reluctantly walking a tightrope of monetary policy unsure of the resiliency to volatility. The clowns are trying to get serious but cannot help scurrying about as the Fed twists and turns. alk down the economy? Celebrate. Talk up the economy? Panic.

Sources: Happy Money Clown, Sad WSJ Clown
So what generated the oohs and aahs from the financial crowd this time?
Minneapolis Federal Reserve Bank President Neel Kashkari: In an essay titled “Nonmonetary Problems: Diagnosing and Treating the Slow Recovery“, Kashkari was about as far away as he could get from talking about an economy in need of rate hikes. He chose to focus on diagnosis and solutions for fixing a slow-growth economy. This essay was released well before U.S. markets opened and fertilized the ground for the next catalyst…
Governor Lael Brainard: In a speech titled “The New Normal’ and What It Means for Monetary Policy,” Brainard distinctly pushed back on imminent rate hikes. In her conclusion, Brainard observed that…
“In today’s new normal, the costs to the economy of greater-than-expected strength in demand are likely to be lower than the costs of significant unexpected weakness…This asymmetry in risk management in today’s new normal counsels prudence in the removal of policy accommodation. I believe this approach has served us well in recent months, helping to support continued gains in employment and progress on inflation.”
These are certainly not the words of a FedHead ready to preside over rate hikes. The market took the ball from there and ran with it.
The performance of the bulls was impressive enough to encourage me to shift back down to a neutral short-term trading call. If the VIX had not opened at such a high level, I would be a lot more comfortable staying cautiously bearish and even looking for the potential of a fade of the S&P 500 at 50DMA resistance. Instead, the current setup has all the looks of another big shake-out of sellers. As such, just like the post-Brexit melt-up, it will not take much more motivation to send the S&P 500 into orbit from current levels.
My trades today once again reflect my mixed approach: 1) I quickly covered my latest short on BHP Billiton (BHP), 2) I flipped call options on Goldman Sachs (GS), 3) I bought more call options on Facebook (FB), 4) and I even bought call options on ProShares Short VIX Short-Term Futures (SVXY) – albeit very late in the game. Most importantly, after I noticed iShares US Home Construction (ITB) lagging the rally, I jumped back into call options. I will review this position in my Housing Market Review for September. While I did not take on any new bearish positions, I DID fail to close out existing bearish positions like my SDS shares and my shares in UVXY (married to a short call). With a bit of hindsight, I think I was not aggressive enough in closing out existing bearish positions (and yes, I am having post-Brexit flashbacks!).
Finally, my last T2108 Update provided a large sampling of charts outlining short and long opportunities. Those still stand. Just a few key updates on three of the charts….
- Wynn Resorts (WYNN) soared 5.7% on the day to reach the top of the trading range with a quickness. I certainly regret selling those call options!
- I am surprised the precious metals did not perform better. Neither GLD nor SLV posted gains even as the U.S. dollar index closed slightly down.
- Baidu (BIDU) started the day with a complete reversal of the stock’s last big jump.
- Whirlpool (WHR) started the day with an open below 200DMA support but rallied to a 1.9% gain.
— – —
Daily T2108 vs the S&P 500

Black line: T2108 (measured on the right); Green line: S&P 500 (for comparative purposes)
Red line: T2108 Overbought (70%); Blue line: T2108 Oversold (20%)
Weekly T2108

*All charts created using freestockcharts.com unless otherwise stated
The charts above are the my LATEST updates independent of the date of this given T2108 post. For my latest T2108 post click here.
Related links:
The T2108 Resource Page
Be careful out there!
Full disclosure: long SDS, long SSO call options, long UVXY shares and short call option, long SVXY put and call options, long SLV call options, long GLD, net long the U.S. dollar, long FB call options
