
The National Association of Realtors (NAR) delivered some history-making news in its quarterly Metropolitan Median Area Prices and Affordability and Housing Affordability Index for the second quarter of 2016. According to the NAR “…for the first time ever, a metro area – San Jose, California – had a median single-family home price above $1 million.” San Jose leads the pack by a wide margin. Specifically, here are the top 5 U.S. metro housing markets by median price including how far behind they are from San Jose.
- San Jose, CA: $1,085,000
- San Francisco, CA: $885,600 (-18%)
- Anaheim-Santa Ana, CA: $742,200 (-32%)
- urban Honolulu, HI $725,200 (-33%)
- San Diego, CA $589,900 (-46%)
This is QUITE a spread in prices just among the top five markets. Number five San Diego is almost half the price of San Jose! The next halving in median price occurs with Austin, TX ranked #25 with a median home price of $289,100. The “good news” here is that San Jose retirees can look forward to cashing in their homes for a comfortable spot in Honolulu with money to spare to buy a nice boat!
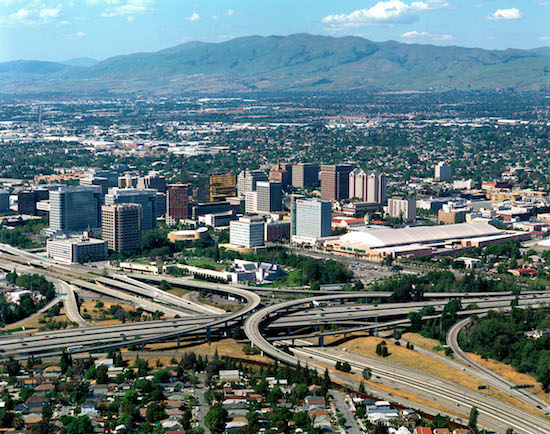
Source: City of San Jose
San Jose reached this milestone with a surprising quarter-over-quarter spurt. The median price increased 11.9% over Q1’s $970K; compare this to the West region’s 9.6% quarterly gain after staying in a range of $316K to $325K. In the three quarters prior to Q1, the median price for San Jose bounced from $980K to $965K to $940K (data from NAR spreadsheet).
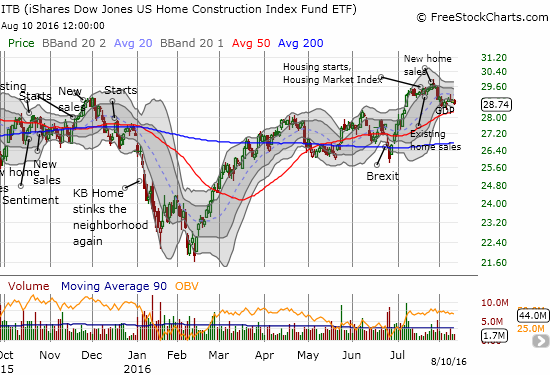
San Jose calls itself the capital of Silicon Valley. This puts the sprawling city right in the middle of the pricey real estate bought up with the riches that high tech has brought the area for many years. (The city of San Francisco is also a popular $1M+ tech destination, but the metro area includes the East Bay which generally rings the register at much lower price points). This news happens to coincide with the tech-heavy Nasdaq (QQQ) hitting a new all-time high yesterday (August 9, 2016).
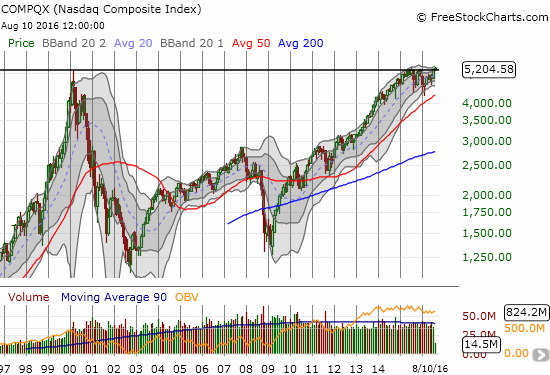
Source: FreeStockCharts.com
Home prices have generally continued to rise at a strong clip since the trough in 2011/2012. The NAR has recently expressed a lot of concern about the rapid price appreciation accompanied by insufficient home building and inventory of homes for sale. Yet, ever declining interest rates have helped to keep the affordability index bouncing along recent post-recession lows.
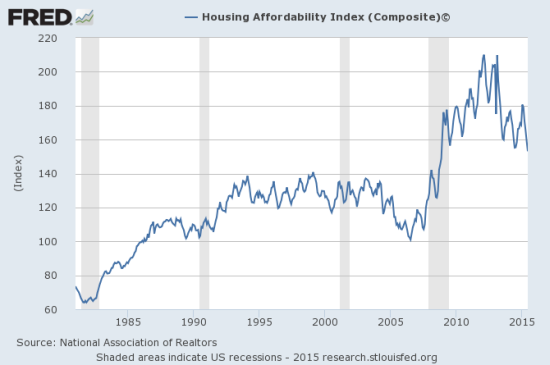
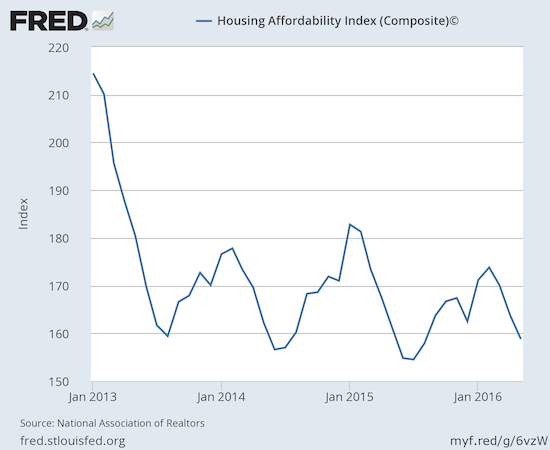
Source: National Association of Realtors, Housing Affordability Index (Composite)© [COMPHAI], retrieved from FRED, Federal Reserve Bank of St. Louis, August 10, 2016. (earlier data from my archive)
In my recent Housing Market Reviews I have chronicled the slipping of housing market conditions in the West relative to the other three regions in the U.S. The high prices are no doubt helping to exert a drag. The San Jose metro area’s million-dollar milestone along with the West’s dominance of the country’s most expensive markets underlines that drag.
Source: FreeStockCharts.com
Be careful out there!