
To-date, I have been using the 30-Day Fed fund futures as a valuable tool for determining likely (short-term) trading direction for the U.S. dollar index (DXY0). However, since the last Federal Reserve decision on monetary policy on July 27, 2016, these futures have exhibited a lot of volatility and thus a lot of noise (assuming the CME’s data are correct of course). In just the past three weeks, the 30-Day Fed fund futures have gone from predicting the Fed’s next rate cut would not happen until at least well into 2017 to predicting a December rate hike to now predicting a near even split between February and March, 2017. The futures market has also predicted nearly everything in between. This churn renders this signal much less effective than before.
In the chart below, the odds for the next rate hike are on the vertical axis. The month of the Fed meeting is on the x-axis. The bars are colored according to the date of a particular snapshot of expectations, ordered from top to bottom in the legend and left to right in the bars of a given month from earliest date to the latest date. The first month that hits the 50% mark for a given snapshot is the month the market predicts will deliver the next Fed rate hike.
Click image to expand for full view…
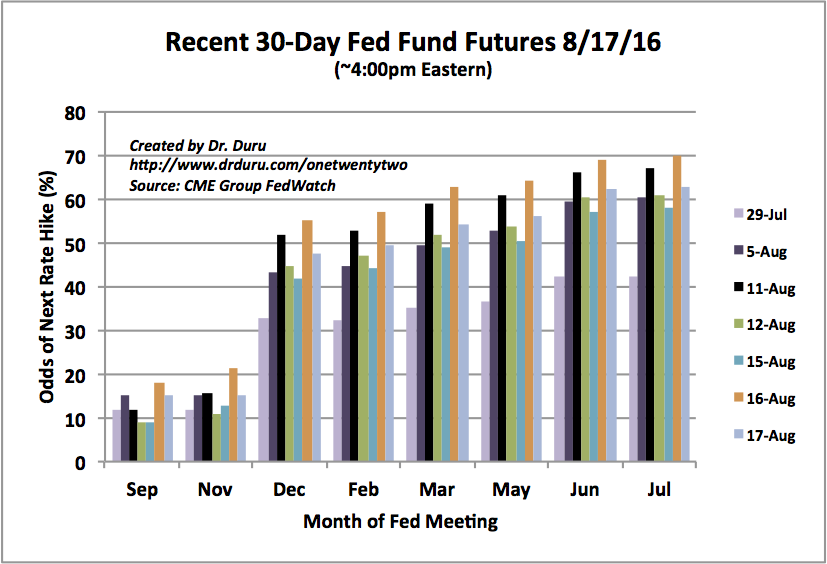
Source: CME FedWatch Tool
This back and forth has occurred amid a battery of economic data delivering rushes of responses. So perhaps the accompanying volatility in rate expectations is an understandable consequence or maybe it is a sequence of over-reactions. Instead of following along, the U.S. dollar has chosen a path of decline. Outside of a 4-day “relief” bounce, the U.S. dollar index (DXY0) has persistently declined. So while the current odds of the next rate hike are much earlier than in the immediate wake of the last Fed meeting, the U.S. dollar index has lost 2.1%. The decline is persistent enough that the dollar’s post-Brexit gains look ready to reverse completely.
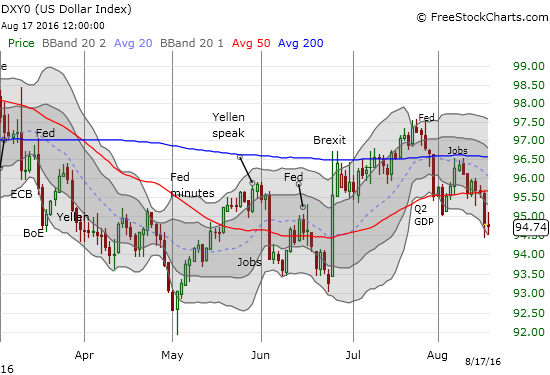
Source: FreeStockCharts.com
With the dollar seemingly unhinging from futures expectations, I have awakened to the increasing importance of the trend. As a result, I have traded a bit more aggressively against the U.S. dollar to offset my core positions long the U.S. dollar. The main challenge is trying to hold through the resolution of this fight at 100 for USD/JPY…
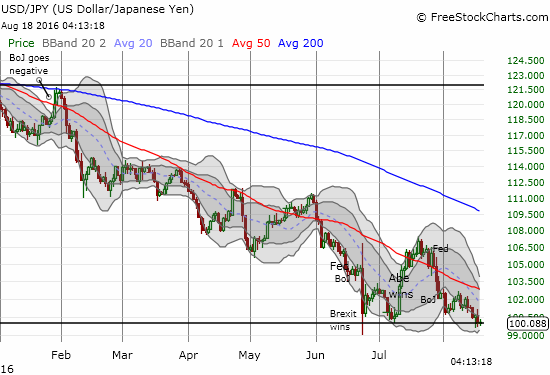
Source: FreeStockCharts.com
Be careful out there!
Full disclosure: net long the U.S. dollar