
(T2108 measures the percentage of stocks trading above their respective 40-day moving averages [DMAs]. It helps to identify extremes in market sentiment that are likely to reverse. To learn more about it, see my T2108 Resource Page. You can follow real-time T2108 commentary on twitter using the #T2108 hashtag. T2108-related trades and other trades are occasionally posted on twitter using the #120trade hashtag. T2107 measures the percentage of stocks trading above their respective 200DMAs)
T2108 Status: 86.2%
T2107 Status: 46.2% (new marginal 8-month high)
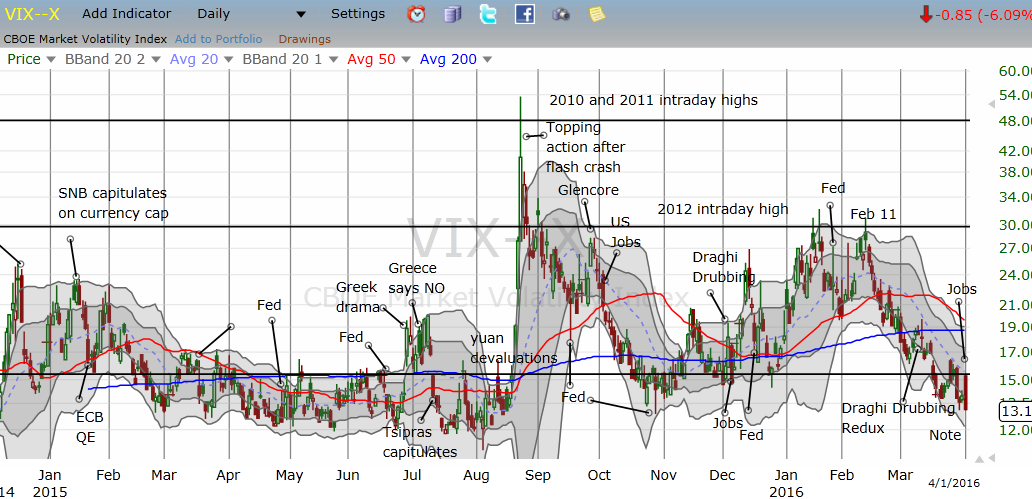
VIX Status: 13.1 (new mrginal 7 1/2 month low)
General (Short-term) Trading Call: cautiously bullish
Active T2108 periods: Day #35 over 20%, Day #34 over 30%, Day #31 over 40%, Day #28 over 50%, Day #24 over 60%, Day #23 over 70%, Day #21 over 80% (overbought)
Commentary
The market delivered a topsy-turvy performance to close the week of trading on April 1, 2016. First and foremost, the S&P 500 (SPY) notably diverged from the price of oil. While the S&P 500 initially dipped to start the day’s trading (presumably in response to a strong jobs report which – gasp – means a strong economy and a slightly higher expectation for interest rates), the index rallied through the rest of the day. United States Oil (USO) gapped down and never mustered even a hint of a rally. The presumed cause of the latest oil angst was a story that the Saudis will only freeze output if Iran promises to do so…from what I understand, Iran is not interested.
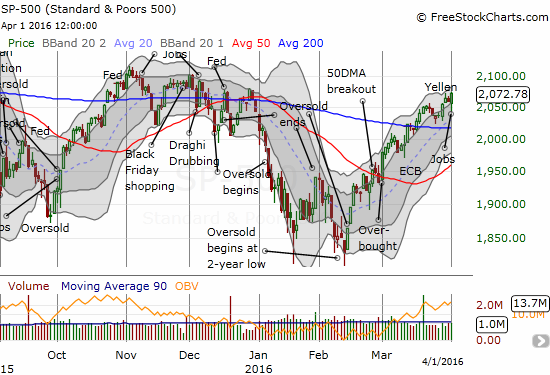
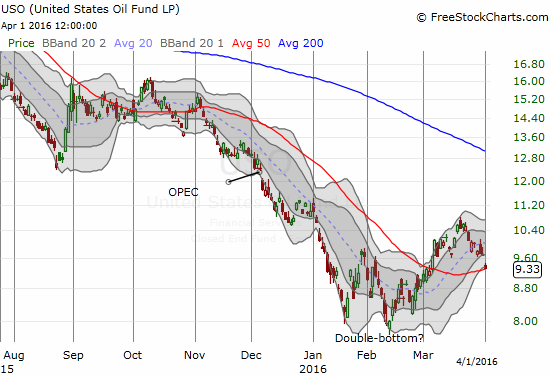
Friday’s wide divergence represents the exclamation mark for a parting of ways that has slowly built since USO’s last peak on March 18th. While oil consistently declined from that point, the S&P 500 hesitated with a very shallow decline that lasted just three days. A decoupling from oil is supposedly bullish given it suggests the market is no longer panicking about a financial contagion from collapsing companies in the oil patch. Hopefully now consumers can focus more on the benefits of paying lower prices for oil.
Anyway, the bullish combination of a resilient T2108 (the % of stocks trading above their respective 40DMAs) and an on-going rise in T2107 (the % of stocks trading above their respective 200DMAs) continues. T2108 has not only been overbought for 23 days but also my favorite technical indicator has traded above 80% for 21 of those days. This extended and stubborn bullishness puts the market right on the edge of take-off. The chart below shows that the overall performance for the S&P 500 for longer durations starts to increase nearly linearly.
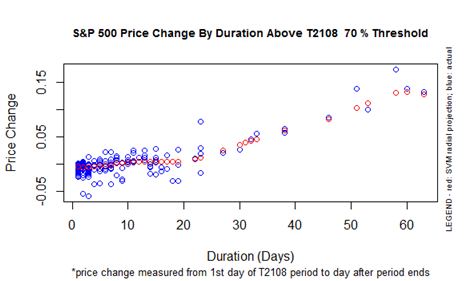
If the overbought period had ended Friday, I would have expected a 2% gain for the S&P 500 for this overbought period. The index has delivered 4.8% so far. Assuming history holds, I anticipate two potential scenarios: 1) the overbought period comes to a quick end in the next few days, or 2) the overbought period proceeds with a lot of chop and marginal gains every few days as projected performance catches up to current performance. Scenario #1 is unlikely given the on-going expansion of T2107. Scenario #2 makes sense given stiff resistance for the S&P 500 resides directly overhead from the three peaks during the warning period from November to December, 2015 (see the chart above).
Note that on any pullback, the 200DMA waits below to provide support for the S&P 500. So with underlying strength combined with likely support, bears will likely need to sit tight for a while longer. Under current trading conditions, in the near-term, I will not even consider the bearish case until the index cracks that support.
Since T2108 has traded over 80% for so long, I pulled out a duration vs performance chart for the 80% overperiod. The data at this duration are a lot more sparse and makes for more difficult conclusions. Most importantly, the S&P 500’s 4% gain during this 80% overperiod is already close to the maximum gain of 5% I would expect given historical data. The historic maximum around 7.5% looks like an outlier. Either way, the LONGEST 80% overperiods were 30 days long. T2108 is still 9 days, almost two trading weeks, away from this historical limit.
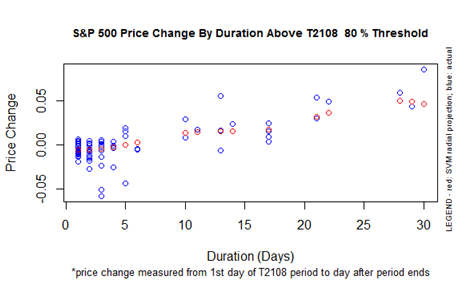
If the S&P 500 gains more than 5% during this overbought period, it looks likely to happen with T2108 in the 70s. This performance seems counter-intuitive on the surface, but it can happen if the strongest stocks cool off a bit and the weakest stocks play a big game of catch-up. T2107 becomes an even more important signal for monitoring this dynamic.
The volatility index, the VIX, adds to the timer ticking away on this overbought period. On Friday, the VIX dropped to the extremely low level of 13.1. Last year, the VIX frequently bounced out of the 12 to 13 range before getting as low as 10.9 on August 5th…just ahead of the flash crash and August Angst. Let’s just say we do not want complacency to get much stronger than current levels.
Click image for an expanded view…
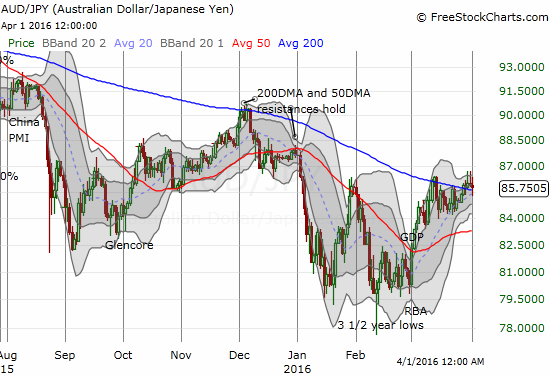
The Australian dollar (FXA) versus the Japanese yen (FXY) finally broke out from 200DMA resistance last week. The move experienced very little follow-through, so AUD/JPY has only marginally added to the bullish signals in the market.
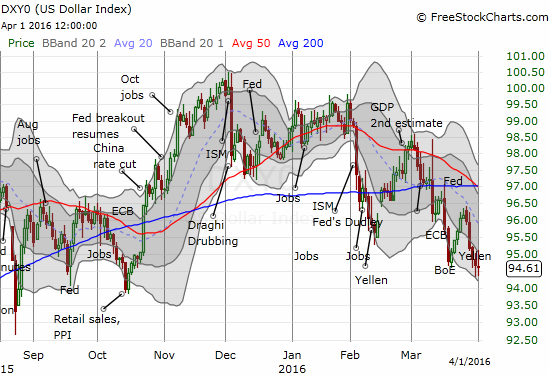
Between the Fed and the jobs report, the U.S. dollar experienced a lot of twists and turns. In the end, the index lost every single day of the week. Friday’s loss is all the more notable given oil’s plunge. Needless to say, the dollar looks like it is still breaking down. As a result, I have been getting incrementally more aggressive in forex on bets against the greenback.
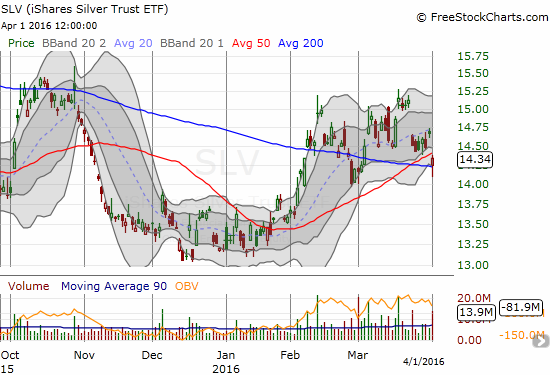
Surprisingly, silver and gold did not benefit this week from the dollar’s latest troubles. So my plan to benefit from buying fists full of call options on iShares Silver Trust (SLV) looks like it will fail unless SLV makes a dramatic turn-around in the next week or so.
— – —
For readers interested in reviewing my trading rules for an oversold T2108, please see my post in the wake of the August Angst, “How To Profit From An EPIC Oversold Period“, and/or review my T2108 Resource Page.
Reference Charts (click for view of last 6 months from Stockcharts.com):
S&P 500 or SPY
U.S. Dollar Index (U.S. dollar)
EEM (iShares MSCI Emerging Markets)
VIX (volatility index)
VXX (iPath S&P 500 VIX Short-Term Futures ETN)
EWG (iShares MSCI Germany Index Fund)
CAT (Caterpillar).
IBB (iShares Nasdaq Biotechnology).
Daily T2108 vs the S&P 500
")
Black line: T2108 (measured on the right); Green line: S&P 500 (for comparative purposes)
Red line: T2108 Overbought (70%); Blue line: T2108 Oversold (20%)
Weekly T2108

*All charts created using freestockcharts.com unless otherwise stated
The charts above are the my LATEST updates independent of the date of this given T2108 post. For my latest T2108 post click here.
Related links:
The T2108 Resource Page
Expanded daily chart of T2108 versus the S&P 500
Expanded weekly chart of T2108
Be careful out there!
Full disclosure: short AUD/JPY, short and long various currencies versus the U.S. dollar, short USO call and put options, long USO call options, long GLD, long SLV call options