
(T2108 measures the percentage of stocks trading above their respective 40-day moving averages [DMAs]. It helps to identify extremes in market sentiment that are likely to reverse. To learn more about it, see my T2108 Resource Page. You can follow real-time T2108 commentary on twitter using the #T2108 hashtag. T2108-related trades and other trades are occasionally posted on twitter using the #120trade hashtag. T2107 measures the percentage of stocks trading above their respective 200DMAs)
T2108 Status: 83.4%
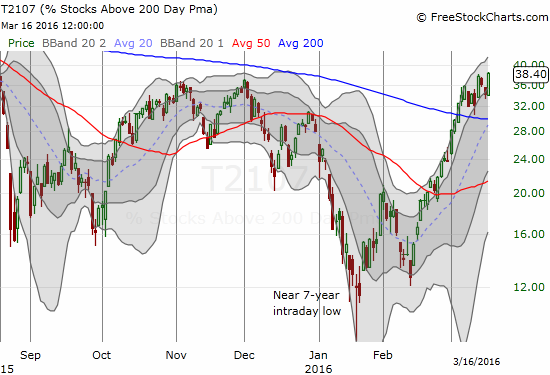
T2107 Status: 38.4% (new 7-month high)
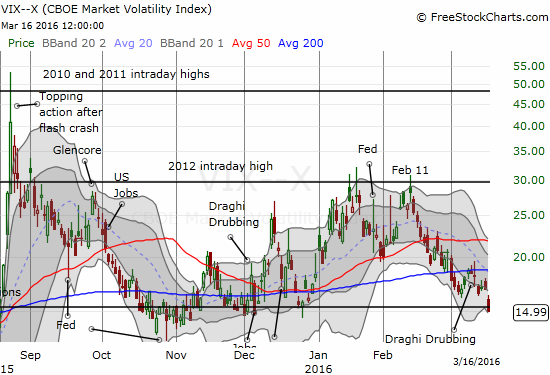
VIX Status: 15.0
General (Short-term) Trading Call: cautiously bullish (see caveats below)
Active T2108 periods: Day #24 over 20%, Day #23 over 30%, Day #20 over 40%, Day #17 over 50%, Day #13 over 60%, Day #12 over 70%, Day #10 over 80% (overbought)
Commentary
I did not know what to expect out of today’s decision on monetary policy from the Federal Reserve. I also did not know how to handicap the market’s reaction. The Fed delivered with a projection of two rate cuts for 2016 that aligned with market expectations. Under such conditions, I would have expected little reaction from the market. Instead, the market’s reaction was very distinct and celebratory. This is where I insert my gratuitous “Damn Daniel!” – a phrase I probably never would have learned without talking to my massage therapist earlier this week. A phrase I feel fits the mood of today’s market celebration.
First, the market’s expectations for the NEXT rate hike backed off by two months, from July to September. I think this reflects some skepticism that the Fed will actually manage to pull off two hikes this year. (As usual, I had to use my own records for previous days as the CME has yet to fix its data for “previous month” and “previous day”).
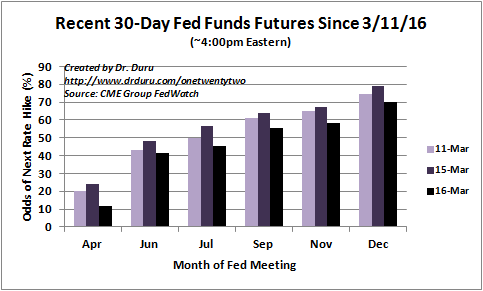
Source: CME Group FedWatch
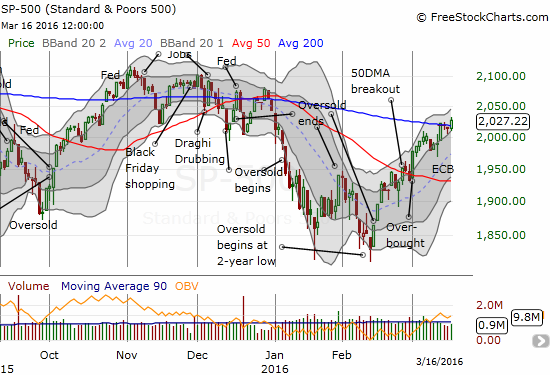
Apparently, this shift in rate expectations helped the S&P 500 (SPY) make an important breakout above resistance at its 200-day moving average (DMA).
T2108, the percentage of stocks trading above their respective 40DMAs, made little progress with a close at 83.5%. However, I am not concerned. As I mentioned before, I do not expect much more progress out of my favorite technical indicator given it is already so elevated. I have now switched to T2107, the percentage of stocks trading above their respective 200DMAs. T2107 soared on the day and just nicked its way to a new 7-month high at 38.4%.
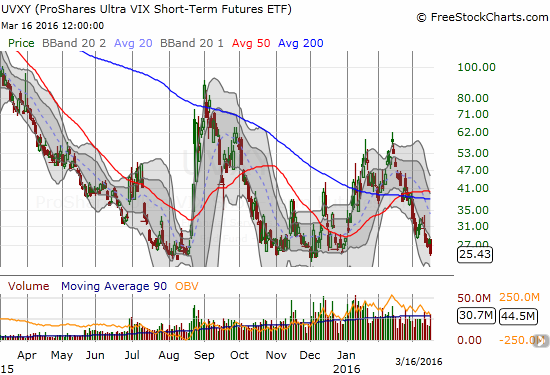
For extra emphasis, the market rammed the volatility index, the VIX, back into the long-standing pivot point. In parallel, ProShares Ultra VIX Short-Term Futures (UVXY) finally returned to its familiar territory of all-time lows.
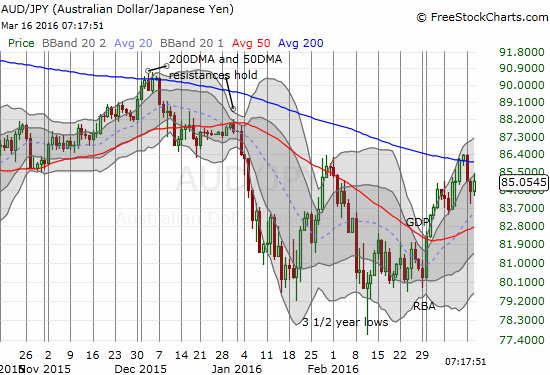
The one holdout is the Australian dollar (FXA) versus the Japanese yen (FXY). AUD/JPY responded as expected under these conditions with a rally, but the pair is still under 200DMA resistance. A bullish overnight report on unemployment in Australia might push this holdout over the edge.
The U.S. dollar index (DXY0) plunged to test the lows for 2016. A VERY important 200DMA breakdown may be underway here. I continue to back off my dollar bullishness under these conditions. I even traded AUD/USD bullishly for the first time in perhaps years!
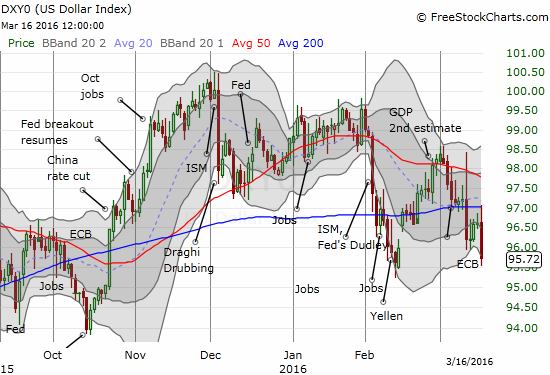
This decline in the dollar is the clearest sign yet that the trade on “policy divergence” is coming to an end. I find this turn of events bizarre given the U.S. has the only major central bank even talking interest rate hikes, but such is the current reality! Next up, I want to see whether the market maintains the post-Fed momentum or pulls off one of its post-Fed fades before regathering itself.
— – —
For readers interested in reviewing my trading rules for an oversold T2108, please see my post in the wake of the August Angst, “How To Profit From An EPIC Oversold Period“, and/or review my T2108 Resource Page.
Reference Charts (click for view of last 6 months from Stockcharts.com):
S&P 500 or SPY
U.S. Dollar Index (U.S. dollar)
EEM (iShares MSCI Emerging Markets)
VIX (volatility index)
VXX (iPath S&P 500 VIX Short-Term Futures ETN)
EWG (iShares MSCI Germany Index Fund)
CAT (Caterpillar).
IBB (iShares Nasdaq Biotechnology).
Daily T2108 vs the S&P 500
")
Black line: T2108 (measured on the right); Green line: S&P 500 (for comparative purposes)
Red line: T2108 Overbought (70%); Blue line: T2108 Oversold (20%)
Weekly T2108

*All charts created using freestockcharts.com unless otherwise stated
The charts above are the my LATEST updates independent of the date of this given T2108 post. For my latest T2108 post click here.
Related links:
The T2108 Resource Page
Expanded daily chart of T2108 versus the S&P 500
Expanded weekly chart of T2108
Be careful out there!
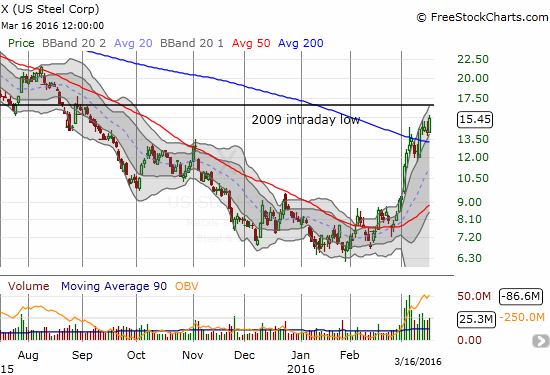
Full disclosure: short AUD/JPY, long and short various currencies against the U.S. dollar, long X call options