T2108 Update (March 18, 2016) – A Different Kind Of Market Breakout

(T2108 measures the percentage of stocks trading above their respective 40-day moving averages [DMAs]. It helps to identify extremes in market sentiment that are likely to reverse. To learn more about it, see my T2108 Resource Page. You can follow real-time T2108 commentary on twitter using the #T2108 hashtag. T2108-related trades and other trades are occasionally posted on twitter using the #120trade hashtag. T2107 measures the percentage of stocks trading above their respective 200DMAs)

T2108 Status: 87.1% (new 5-year high)
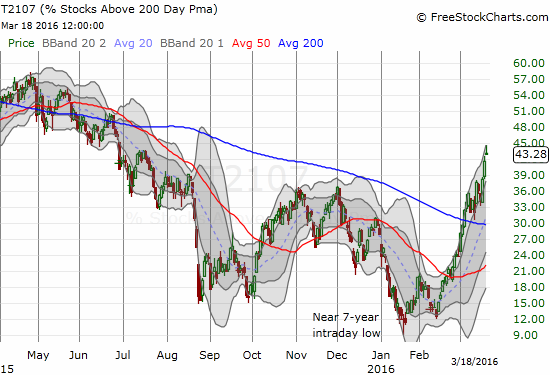
T2107 Status: 43.3% (new 8-month high)
VIX Status: 14.0
General (Short-term) Trading Call: cautiously bullish
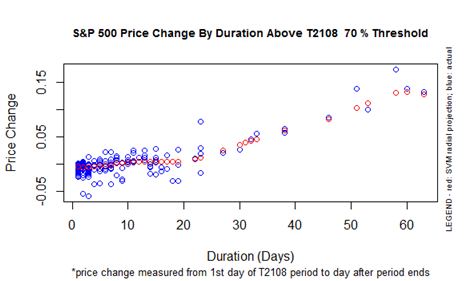
Active T2108 periods: Day #26 over 20%, Day #25 over 30%, Day #22 over 40%, Day #19 over 50%, Day #15 over 60%, Day #14 over 70%, Day #12 over 80% (overbought)

Commentary
The S&P 500 (SPY) is UP year-to-date 0.2%. That does not sound like much for mid-March, but consider from whence we came…


The S&P 500 (SPY) has finally reversed all its losses for the year just as it has printed a bullish breakout above 200-day moving average (DMA) resistance.

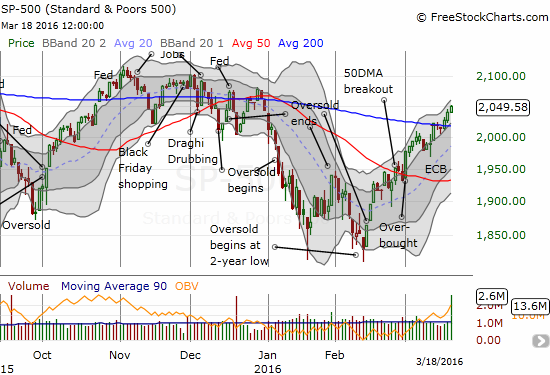
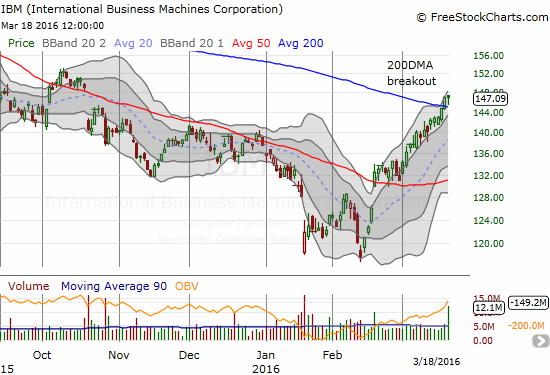
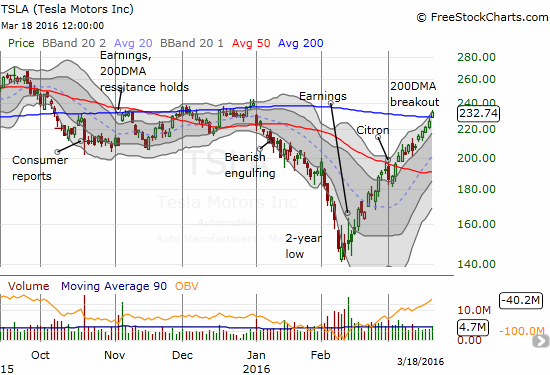
The S&P 500 (SPY) has now closed three straight days with gains above its 200DMA. The last 200DMA breakouts occurred from October through December and turned out to be false breakouts. Those breakouts were accompanied by deteriorating technicals and carried lots of warnings that I chronicled in the T2108 Updates at that time. The technicals this time around are strengthening; a broad swath of stocks are participating in the fun. This rally is a different kind of breakout.

T2108, the percentage of stocks trading above their 40-day moving averages (DMAs), is overbought (greater than 70%) but is holding firm at 87.1%, a 5-year high. T2108 has been overbought for 14 days. The stock market is just over a week away from hitting the overbought tipping point where an extended overbought rally has historically launched.


S&P 500 Performance By T2108 Duration Above the 70% Threshold

Even more importantly, T2107, the percentage of stocks trading above their 40-day moving averages (DMAs), is still increasing. It closed at 43.3%, an 8-month high.


The momentum behind the rally remains strong as more and more stocks are trading above the critical long-term 200DMA.

So THIS 200DMA breakout for the S&P 500 is much different than the others. The technicals are strong and actually improving. I will of course reassess the situation if T2108 starts declining, T2107 stalls, and/or especially if the S&P 500 closes below its 200DMA. Surprisingly, the Australian dollar is STILL struggling to break 200DMA resistance against the Japanese yen, so that indicator continues to flash a mild warning. AUD/JPY keeps my trading call at cautiously bullish.

I have used the on-going rally to cash out on longs. I have flipped through several call option positions. I have also built up a few more hedges. With hindsight, I have done a little too much selling and a little too much hedging. I will be looking to trade a little more bullishly going forward. Commodities in particular are providing some juicy speculative plays for going long. However, my latent bearishness on commodities has me sticking to pairs trades. (I am still very overdue on writing about my latest strategies here).

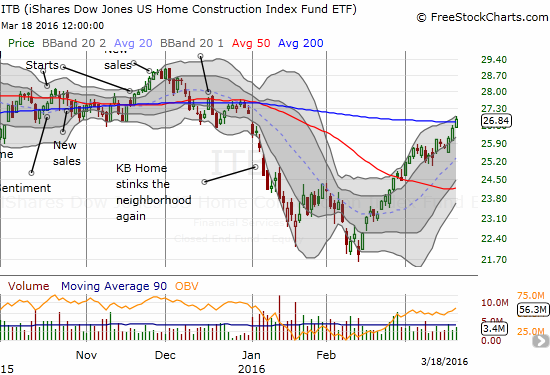
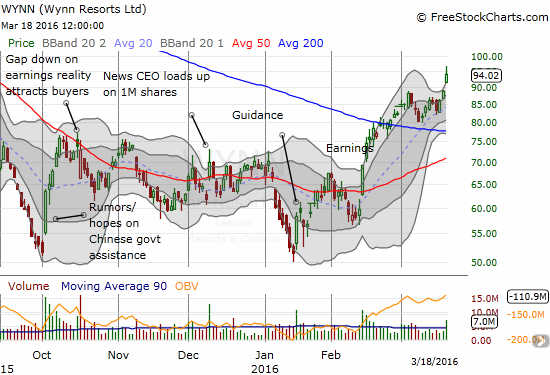
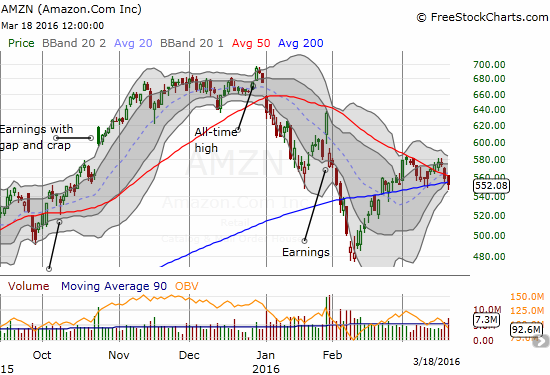
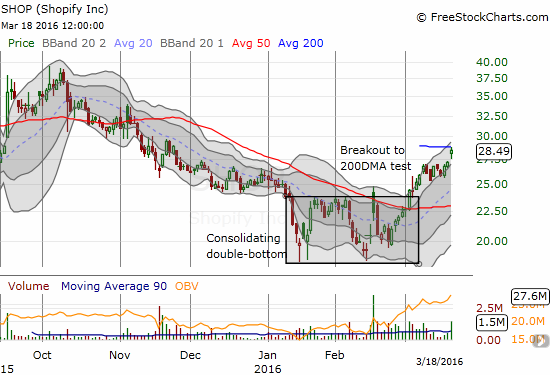
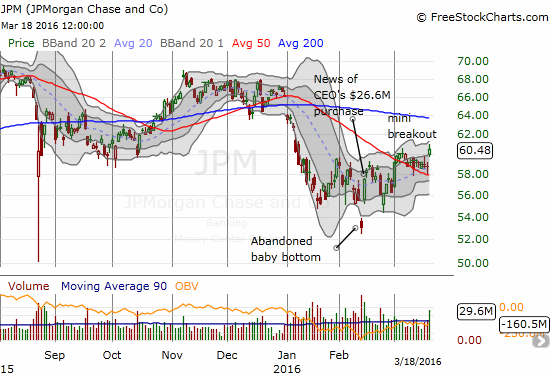
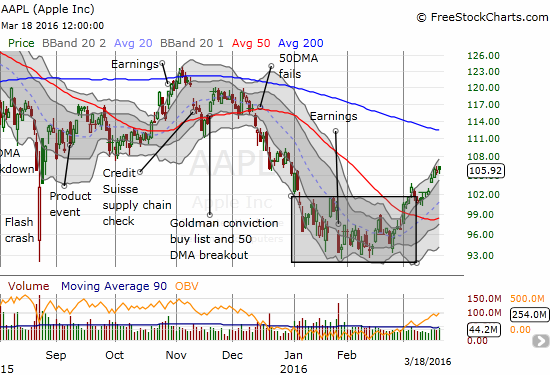
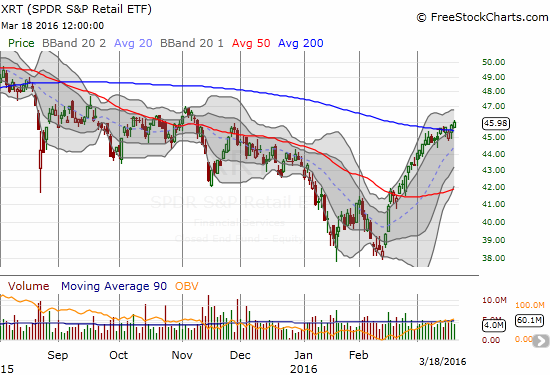
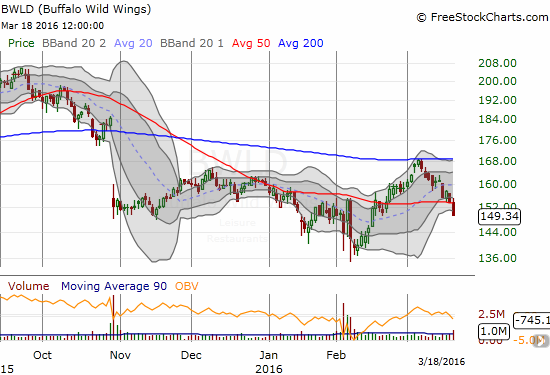
Here are some charts for trade ideas and updates on previous trades I have proposed. See the captions for details.


During this rally, I have been happiest about the bounce in iShares US Home Construction (ITB). I have had a laser focus on taking advantage of reactionary fears of recession to load up on housing stocks and options. On Friday, I finished selling most of these positions, but I still have my call options on ITB.

You KNOW there's a broad rally going on when even International Business Machines Corporation (IBM) is rallying. The IBM rocket from the February low has turned into a bullish 200DMA breakout.
You KNOW there’s a broad rally going on when even International Business Machines Corporation (IBM) is rallying. The IBM rocket from the February low has turned into a bullish 200DMA breakout.
Wynn Resorts Ltd. (WYNN) is finally paying off for the CEO. An upgrade drove a bullish breakout today. I sold my call options a day too early but felt compelled to do so because of a Friday expiration.
Amazon.com (AMZN) is showing relative weakness. I have been paitently playing to the long side to no avail since the big March 1st surge. Follow-through selling from here will lead to a very bearish 200DMA BREAKDOWN.
Shopify Inc. (SHOP) extended its bullish breakout on rumors of a buyout by Google (GOOG)
Tesla Motors, Inc. (TSLA) remains on a tear. It has joined the club of 200DMA breakouts. When I made the call for a quick reversal of Citron's takedown, I never imagined TSLA would do THIS well.
Tesla Motors, Inc. (TSLA) remains on a tear. It has joined the club of 200DMA breakouts. When I made the call for a quick reversal of Citron’s takedown, I never imagined TSLA would do THIS well.
Caterpillar (CAT) valiantly fought off early weakness after reporting its retail sales numbers. It was even UP for the day. Needless to say this second 200DMA breakout is very bullish for CAT AND the general market.
iShares MSCI Emerging Markets (EEM) tested 200DMA resistance and lost. Volume is surging, so the breakout is likely right around the corner. My latest strangle play on EEM was far too small on the side of call options!
The junk high-yield scare is definitely over for now. SPDR Barclays High Yield Bond ETF (JNK) has recovered smartly from the February lows...which was right around the time JNK caught my bearish attention.
The junk high-yield scare is definitely over for now. SPDR Barclays High Yield Bond ETF (JNK) has recovered smartly from the February lows…which was right around the time JNK caught my bearish attention.
JPMorgan Chase & Co. (JPM) is just barely breaking away from its 50DMA, but I think it is the biggest story of this bounce. We should officially call this the Jamie Dimon bounce given his insider buying happened to mark the exact bottom of the market. It was the purchase that launched a 1000 ships (stocks)!
Apple (AAPL) seems destined for a 200DMA retest before April earnings. The move has been soooo slow though that I have still not yet bothered to try some quick swing trades. It may be time to place a longer duration bet on the 200DMA retest.
SPDR S&P Retail ETF (XRT) has gone from my slam dunk short of December and January ("A Time to Short the SPDR S&P Retail ETF") to a slamdunk play for the bulls. A 200DMA breakout is nearly confirmed.
SPDR S&P Retail ETF (XRT) has gone from my slam dunk short of December and January (“A Time to Short the SPDR S&P Retail ETF”) to a slamdunk play for the bulls. A 200DMA breakout is nearly confirmed.

Buffalo Wild Wings (BWLD) is my token bearish chart. BWLD broke down from 50DMA support on high volume. This confirms the failure at 200DMA resistance and puts a retest of the February lows into play.

— – —

For readers interested in reviewing my trading rules for an oversold T2108, please see my post in the wake of the August Angst, “How To Profit From An EPIC Oversold Period“, and/or review my T2108 Resource Page.

Reference Charts (click for view of last 6 months from Stockcharts.com):
S&P 500 or SPY
U.S. Dollar Index (U.S. dollar)
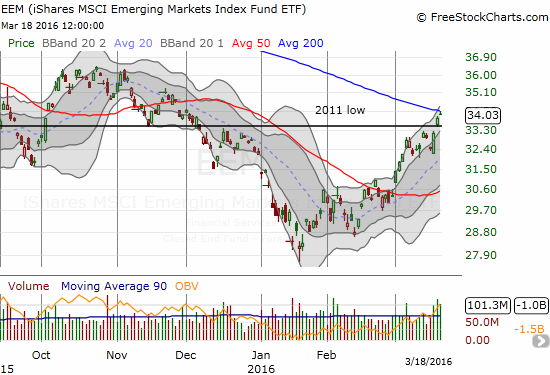
EEM (iShares MSCI Emerging Markets)
VIX (volatility index)
VXX (iPath S&P 500 VIX Short-Term Futures ETN)
EWG (iShares MSCI Germany Index Fund)
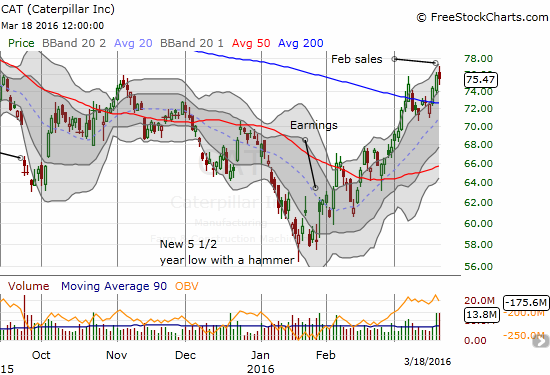
CAT (Caterpillar).
IBB (iShares Nasdaq Biotechnology).


Daily T2108 vs the S&P 500

Black line: T2108 (measured on the right); Green line: S&P 500 (for comparative purposes)
Red line: T2108 Overbought (70%); Blue line: T2108 Oversold (20%)


Weekly T2108
Weekly T2108
*All charts created using
freestockcharts.com unless otherwise stated

The charts above are the my LATEST updates independent of the date of this given T2108 post. For my latest T2108 post click here.

Related links:
The T2108 Resource Page
Expanded daily chart of T2108 versus the S&P 500
Expanded weekly chart of T2108

Be careful out there!

Full disclosure: short AUD/JPY, long put options on CAT and EEM, long call options on AMZN and ITB

Leave a Comment

This site uses Akismet to reduce spam. Learn how your comment data is processed.