
(This is an excerpt from an article I originally published on Seeking Alpha on January 19, 2016. Click here to read the entire piece.)
For a brief moment on January 15, 2016, the S&P 500 (SPY) looked ready to extend the sell-off that ended with the August Angst of 2015. At 1858, the index was trading marginally lower than the lows from the August flash crash and the next day’s confirming close. That move would have marked a new 15-month closing low. Instead, the S&P 500 managed to bounce back and cling to support.
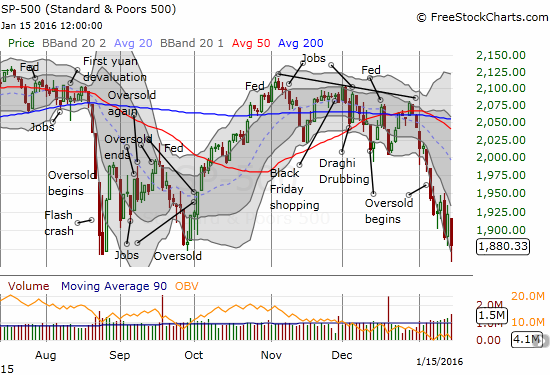
Source: FreeStockCharts.com
The big question hanging over the market now is whether this correction (10%+ loss from last all-time high) will finally begin a march to a bear market (20%+ loss from last all-time high). In early September, I modified the model of another Seeking Alpha author to demonstrate how to use the 200-day moving average (DMA) of the S&P 500 as one tool for assessing the prospects for this kind of sell-off. {snip}
The last two sell-offs following all-time highs started in 2000 and 2007. The 200DMA signal gave ample warning of further selling in both cases. The two periods are connected in that the market finally re-achieved a new all-time high in May, 2007 only to peak again in just 4 more months. This time around, the market has enjoyed over two years of fresh all-time highs. Thus, I am assuming the market has more latent momentum than it had going into the 2007 peak. {snip}
{snip}
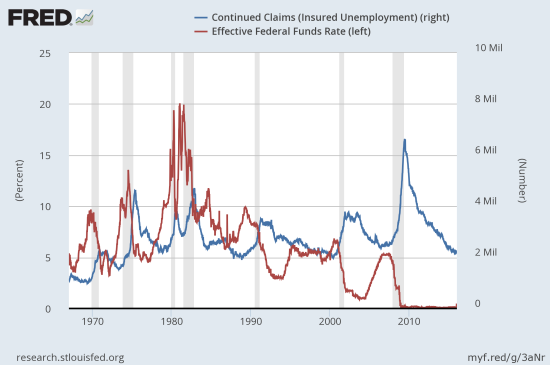
Source: US. Employment and Training Administration, Continued Claims (Insured Unemployment) [CCSA], retrieved from FRED, Federal Reserve Bank of St. Louis, January 18, 2016; and Board of Governors of the Federal Reserve System (US), Effective Federal Funds Rate [FF], retrieved from FRED, Federal Reserve Bank of St. Louis, January 18, 2016.
{snip}
{snip}
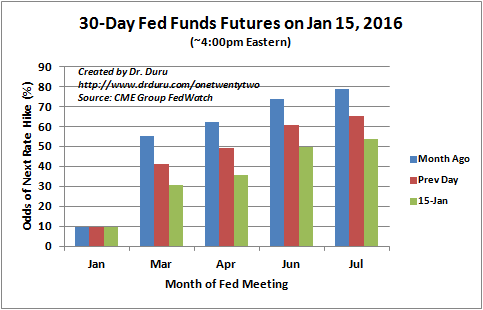
Source: CME Group FedWatch
Assuming the Federal Reserve will continue to follow the market’s expectations in an effort to avoid surprises to financial markets, then it seems reasonable given all the above data to expect a recession is not in the cards for this year. I am even doubtful a recession is in the cards for 2017, but I am not yet willing to make such bets.
{snip}
In other words, an imminent recession is unlikely, but no catalysts are coming on the horizon to rescue market sentiment. On-going recession panic in financial markets will continue rearing its ugly head in the form of selling pressure on stocks… {snip}
Be careful out there!
Full disclosure: long SSO call options and shares
(This is an excerpt from an article I originally published on Seeking Alpha on January 19, 2016. Click here to read the entire piece.)