
We hear the relationship claimed so casually and so frequently, we probably no longer give it a second thought.
For example, on December 30th, the S&P 500 (SPY) lost 0.7%. Searching for an explanation, CNBC ran the all-too familiar headline “Dow closes down triple digits as oil slide weighs.” Oil lost 3.3% on the day on “supply concerns.” Ironically, the article did not explain the connection between oil and the stock market and instead included attempts from two interviewees to dismiss the trading action because of light volume:
“U.S. stocks closed lower Wednesday in low volume trade as a decline in oil prices weighed…
‘The real story of the day is oil’s down 3 percent and that’s been weighing all day. Not much to be read into this light volume (trading session),’ said Peter Coleman, head trader at Convergex…
‘I think the most important factor here is we’re at year-end. There isn’t much volume so it’s very easy to move markets either way,’ said Peter Cardillo, chief market economist at First Standard Financial.”
And then this refreshingly honest assessment from a strategist with TD Ameritrade:
“‘All of a sudden the whole world’s focused on oil again…It’s actually a simple trade from that point of view. We’re following that because there’s nothing much (else)’…”
In other words, the oil slide was weighing on oil. Not much else to infer from there. Regardless, I am frankly quite weary of the causal associations made between oil and the stock market. First of all, I find it VERY odd to try to draw a direct correlation between something at multi-year lows and another thing just barely off all-time highs. If anything, our default should be to assume an INVERSE correlation.
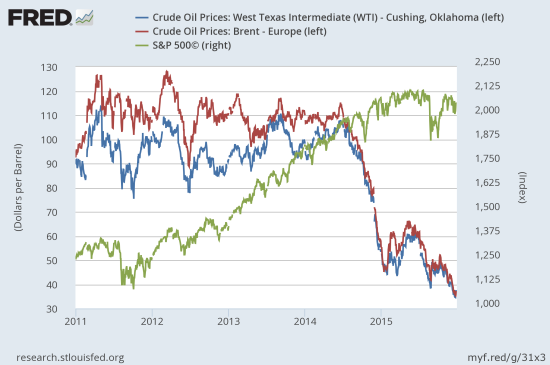
Source: US. Energy Information Administration, Crude Oil Prices: West Texas Intermediate (WTI) – Cushing, Oklahoma [DCOILWTICO], retrieved from FRED, Federal Reserve Bank of St. Louis, January 2, 2016.
US. Energy Information Administration, Crude Oil Prices: Brent – Europe [DCOILBRENTEU], retrieved from FRED, Federal Reserve Bank of St. Louis, January 2, 2016. S&P 500 prices also from FRED.
I was particularly dismayed a week ago while listening to Bloomberg TV through the Bloomberg Business app. The host/pundit confidently started talking about the strong relationship between the market and oil. Without a timeframe or context, she claimed that oil and the market have a 0.4 correlation which is supposedly strong enough to convey a causal relationship. Nevermind that correlation does not mean causation. A reading of 0.4 is quite inconsequential for a correlation. Being positive is not enough. Correlation ranges from -1 to 0 to 1, from perfectly inversely correlated (-1) to completely uncorrelated (0) to perfectly correlated (1).
This assault on correlations tipped me over the edge enough to write this missive. I went to Excel and calculated the numbers for myself. I used daily oil data from the above chart and S&P 500 daily data from Yahoo Finance for 2015 through December 28th. I tried as hard as I could to cherry pick a strong correlation. All dates are for 2015 and correlations are calculated on daily percentage changes. I used WTI prices…
year-to-date: 0.28
since April 1: 0.31
since July 1: 0.35
since Oct 1: 0.26
since Dec 1: 0.16
Last 7 trading days: 0.54
No matter how you look at it, there has been little to no correlation between the daily price change of oil and the S&P 500. I could barely produce the 0.4 correlation during the time period the Bloomberg host had available. These results suggest that at the very least, market commentators should stop observing that oil and the market moved together or that one moved in a direction in spite of the other as if there is supposed to be a relationship.
The reason why these commentators can skate by on this egregious error is because it just so happens that oil and the S&P 500 HAVE tended to move in the same direction this year on a daily basis. The following data provides a breakdown through December 28, 2015 expressed as the percentage of trading days in the year for the stated combination of daily changes:
Both oil and the S&P 500 up: 26%
Both oil and the S&P 500 down: 36%
Oil up, S&P 500 down: 16%
Oil down, S&P 500 up: 21%
This breakdown means that 62% of the trading days in 2015 featured oil and the S&P 500 moving in the same direction. Thus, commentators can feel quite comfortable and casual about drawing connections between oil nd the stock market. The poor correlations are a result of the inconsistent magnitudes in the way oil and the S&P 500 change day-to-day. Here are some stark examples:
On December 11, 2015, oil dropped 3.0% while the S&P 500 dropped 1.9%. Two pretty bad moves. On December 28, oil dropped 3.4% but the S&P 500 only fell 0.2%. To make matters worse, on December 16th, oil dropped a whopping 4.7% yet the S&P 500 GAINED a cool 1.5%. Finally, when oil soared 4.5% on December 22, the S&P 500 did not soar. It only gained 0.9%. This is how December became the LEAST correlated time period in the list I provided above. I could draw similar examples to explain the poor correlations in the other time periods.
So instead of reaching for explanations of market moves based on what oil is doing, we retail investors should just enjoy the discounts we get at the pump. After all, there is no telling when the market’s cllective manipulators will gather themselves enough to push oil ever higher again.
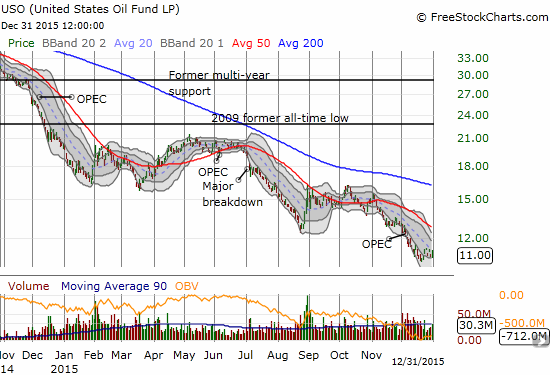
Source: FreeStockCharts.com
Be careful out there!
Full disclosure: short USO put and call options
Ahhh, a refreshing sip of sanity to start the new year :-).
🙂