
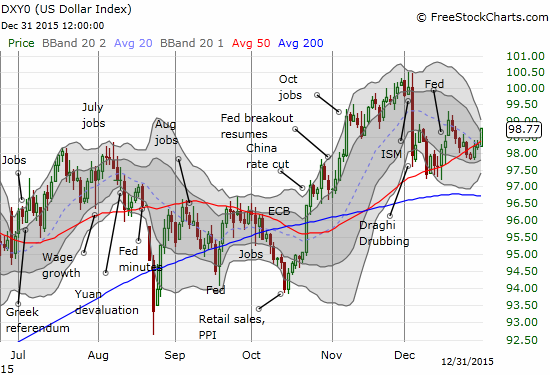
The U.S. dollar index ended 2015 on a strong note, but it has yet to develop any post-Fed momentum. Of the ten trading days following the rate hike from the U.S. Federal Reserve, the index has closed below that day’s intraday high five days. Notably, the intraday LOW of that day is still holding strong and coincides with still uptrending support from the 50-day moving average (DMA).
The lack of post-Fed momentum can be seen even more clearly against the euro (FXE). EUR/USD closed decidedly lower the day of the rate hike, but the currency pair has yet to trade any lower. The euro-strength induced by the “Draghi Drubbing” remains intact.
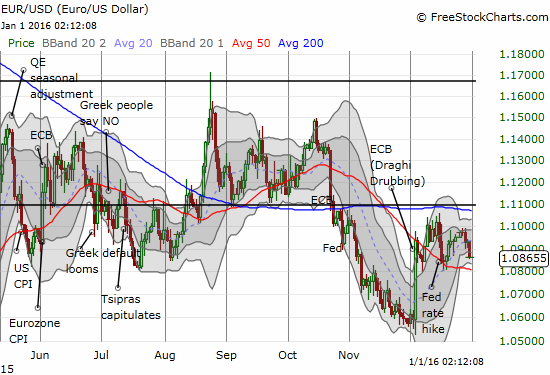
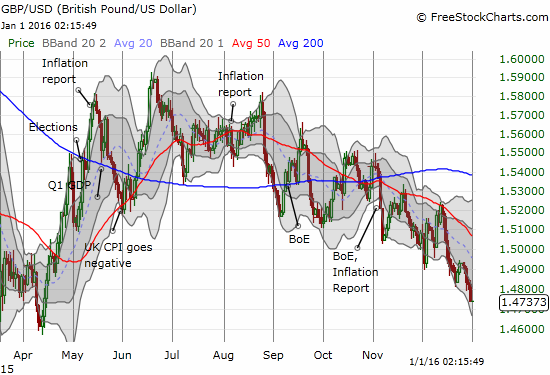
The virtual stasis for EUR/USD since the Draghi Drubbing is very interesting because policy divergence is most compelling between the U.S. and the eurozone. Meanwhile, the United Kingdom is getting a pass from currency markets. The surprising weakness in December against all major currencies gives the appearance that the market expects the Bank of England to capitulate on hiking rates altogether. Against the U.S. dollar, the British pound (FXB) is approaching an 8-9 month low.
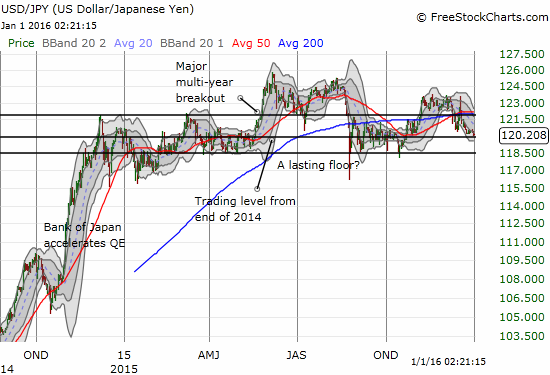
And then there is the Japanese yen (FXY). USD/JPY practically ended the year where it began. The middle contained some large swings. Overall, the market has yet to make up its mind on which currency is the dominant one. I am looking to 2016 to break the logjam. One extreme analyst expects USD/JPY to hurtle back to 100: see “JPMorgan Says Japan Inc. Must Prepare for Yen Below 100 a Dollar.” If USD/JPY cracks below the floor show in the chart below, I will assume 100 as a definite even if a slow-burning downside risk for USD/JPY.
Source of charts: FreeStockCharts.com
The market’s tentativeness on the U.S. dollar comes even as the market expects more rate hikes ahead. The market expects the next hike to come as soon as March.

Source: CME FedWatch
Until or unless these odds move further out into the year, sticking to bullish dollar bets generally still makes sense to me. The Japanese yen looks most ready to benefit from any renewed dollar weakness. However, I still think the market’s hesitation presents a slow motion buying opportunity on the U.S. dollar.
The market’s indecision can be seen even clearer in yields on U.S. Treasury bonds. Short-term rates have gone up mainly becuse they “have to.” The Fed wields most influence over short-term rates. Going out to 10, 20, and 30-year yields, the market simply does not yet believe inflation is on the way. Yields are barely budging – the longer-term yields have not even crossed the 2015 highs set back in June!
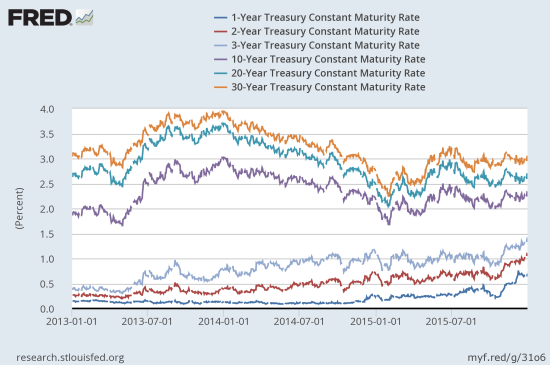
Source: Board of Governors of the Federal Reserve System (US), 1-Year Treasury Constant Maturity Rate [DGS1], 2-Year Treasury Constant Maturity Rate [DGS2], 3-Year Treasury Constant Maturity Rate [DGS3], 10-Year Treasury Constant Maturity Rate [DGS10], 20-Year Treasury Constant Maturity Rate [DGS20], 30-Year Treasury Constant Maturity Rate [DGS30] all retrieved from FRED, Federal Reserve Bank of St. Louis, January 1, 2016.
The stasis in long-term rates has made me interested in range-bound trading in the iShares 20+ Year Treasury Bond (TLT). At least TLT IS starting to develop SOME post-Fed momentum (lower prices mean higher rates).
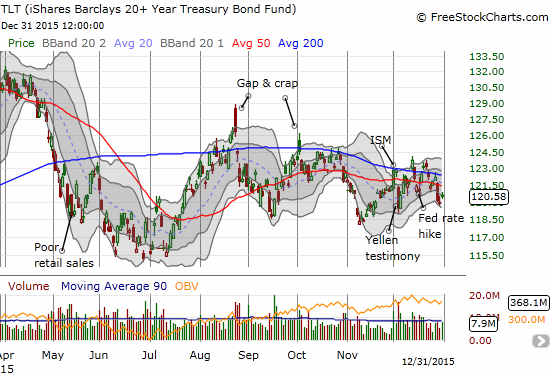
Source: FreeStockCharts.com
A piece in the Economist titled “Low and behold: Another year of low prices will create strains in the world economy” helped me understand this divergence in yields. Essentially, longer-term yields are barely responding because of worries over on-going global deflationary pressures:
“…global inflation is a tug-of-war between bottlenecks in parts of the rich world and imported deflation from emerging markets, and the enduring fall or stagnation of prices looks set to dominate for a while yet.”
The Economist describes three stark examples of “lowflation.” Saudi Arabia has helped drive oil prices well below levels required to maintain its massive public spending programs. Like oil-exporting Kazakhstan and Azerbaijan, Saudi Arabia may soon be forced to drop its peg to the now strong dollar. As China struggles to maintain the high growth rates it needs, its pacing with the U.S. dollar could become increasingly problematic. An unanchored Chinese currency could touch off significant devaluations around Asia. Finally, lowflation could create an increasingly “lopsided” economy in the U.S. with services motoring along and manufacturing increasingly suffering. The Economist concludes:
“All this would make for a strangely configured economy by the end of the year. An unemployment rate of 4%, a Fed Funds rate below 1%, an overvalued dollar, a strong housing market and inflation below the Fed’s target of 2% is a plausible, if very odd, mix, which could portend either a sudden burst of inflation or enduringly feeble demand.”
Most importantly for trading the U.S. dollar is that the export of deflation from struggling global economies should put further upward pressure on the U.S. dollar even if the Fed decides to stop hiking rates. Perhaps the Japanese yen might absorb those pressures, but the Bank of Japan (BoJ) is likely to act (panic?) against such pressures.
In other words, the U.S. dollar will continue to occupy center stage in 2016. Buckle up!
Be careful out there!
Full disclosure: net long the U.S. dollar, long FXE call options, long TLT put options, long TLT call spread