In recent months, I have been in the habit of fading rallies in Market Vectors Russia ETF (RSX) using Direxion Daily Russia Bear 3X Shares (RUSS) for quick, short-term trades. That streak may be on the verge of ending.

Source: FreeStockCharts.com
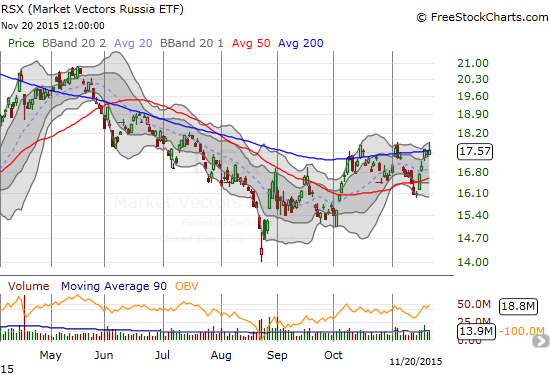
As the chart shows, RSX looked like it was ready to resume its downtrend when it broke through support at its 50-day moving average (DMA) last week. THIS week, RSX turned 180 degrees and picked up enough momentum to briefly break through 200DMA resistance. Volume has picked up as well.
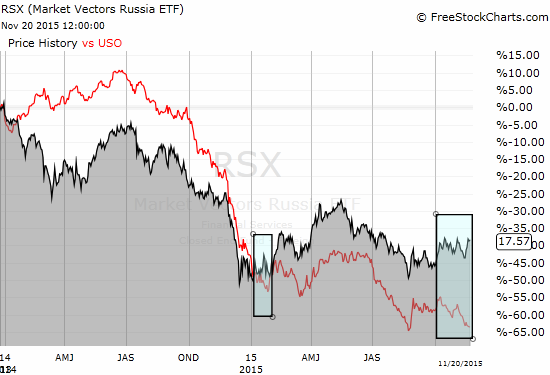
This rally particularly caught my attention because oil prices declined this week and even dipped below $40/barrel. I had counted on a tight correlation between RSX and oil, United States Oil Fund LP (USO) in particular. USO is of course an imperfect proxy for oil prices, but it is one of the best and most liquid options available to retail equity traders. The chart below juxtaposes RSX and USO going back to early last year. The two have danced pretty well together outside of two key areas, including the last two months (see the rectangles).

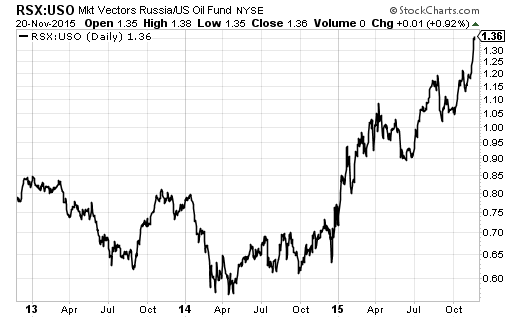
Creating a ratio of RSX/USO reminds us that despite the long stretches of closely correlated behavior, RSX has greatly outperformed USO in 2015 overall: year-to-date, RSX is up 20.0% (despite the current downtrend from May’s peak), and USO is DOWN 36.5%.

Source: StockCharts.com
Given this out-performance, I am wondering whether RSX is on the verge of a rally similar to the one that started the year after it diverged from USO. One potential driver of a breakout for RSX is the beginning of more cooperation between Russia and the U.S. The security interests of the two countries may converge over terrorism despite the on-going disputes over Ukraine. (Hat tip to someone on StockTwits who suggested this possibility). I know an independence from oil revenues will NOT be a driver anytime soon. Regardless, if RSX breaks out, I will end my fades and get on board for a potential extended rally.
Since I am talking about USO, this is good time to review the performance of my “rangebound” trade on USO. USO has declined 17% since I initiated the trade. USO also looks like it will easily break to new lows and violate my rangebound assumption. Fortunately, for now, my position remains flat. This is the advantage of selling both sides of a strangle (out of money calls and puts). However, with the short call approaching zero in value, my buffer against further declines in USO is wearing thin.
If USO breaks down, I will find a spot to renew the trade. I still believe that oil will stabilize at SOME level soon. The U.S. Federal Reserve even believes oil prices will begin to rise again next year. When oil does stabilize, selling options should work very well; especially if the USO volatility measure (OVX) spikes higher again. The days going into or immediately following OPEC’s December meeting might deliver that opportunity. I will write a follow-up piece when (if?) the time comes to make the new trade.
I am also considering a NEW trade: a pairs trade between RSX and USO. Long RSX and short USO (or long SCO) on a RSX breakout.
Be careful out there!
Full disclosure: short USO calls and puts, long USO calls, long RUSS
