
(T2108 measures the percentage of stocks trading above their respective 40-day moving averages [DMAs]. It helps to identify extremes in market sentiment that are likely to reverse. To learn more about it, see my T2108 Resource Page. You can follow real-time T2108 commentary on twitter using the #T2108 hashtag. T2108-related trades and other trades are occasionally posted on twitter using the #120trade hashtag. T2107 measures the percentage of stocks trading above their respective 200DMAs)
T2108 Status: 49.9%
T2107 Status: 32.7%
VIX Status: 15.5
General (Short-term) Trading Call: neutral (just switched from bearish)
Active T2108 periods: Day #35 over 20%, Day #34 over 30%, Day #5 over 40% (overperiod), Day #7 below 50%, Day #9 under 60%, Day #349 under 70%
Reference Charts (click for view of last 6 months from Stockcharts.com):
S&P 500 or SPY
SDS (ProShares UltraShort S&P500)
U.S. Dollar Index (volatility index)
EEM (iShares MSCI Emerging Markets)
VIX (volatility index)
VXX (iPath S&P 500 VIX Short-Term Futures ETN)
EWG (iShares MSCI Germany Index Fund)
CAT (Caterpillar).
IBB (iShares Nasdaq Biotechnology).
Commentary
Going into the August Angst, I frequently pointed out what I thought of as a dangerous narrowing of market performance. I have finally stumbled across some stark quantification of the sharp divergence of performance between the top stocks and the rest of the S&P 500. Money manager Whitney Tilson found the following on November 20, 2015:
“…the 10 largest stocks (by market cap) in the S&P 500 are up 13.9%, while the other 490 are down 5.8%. This 19.7% spread is the largest in 15 years and has only been larger twice (in 1998 & 1999, at the peak of the internet bubble)…
The 10 largest stocks are (in order): Apple, Google (both classes of shares), Microsoft, Exxon Mobil, GE, J&J, Wells Fargo, Berkshire Hathaway, Amazon and JPMorgan Chase (the numbers would be even more skewed if the #11 stock, Facebook, were included, as it’s up 38% YTD).”
This is an incredibly narrow market. While there is no formula from here to a massive sell-off, this kind of unbalance merits monitoring. I find it prudent to assume the market is very vulnerable until this unbalance improves.
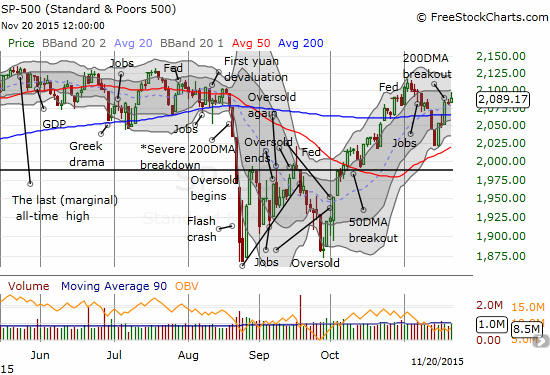
T2108 closed the week at 49.9% – smack in the middle of neutral territory and no gain from Thursday. The S&P 500 gained 0.5% on the day to close out a tremendous week. The index sprinted higher for a 3.3% gain on the week. This seems strong except the move failed to reverse the big loss from the previous week. While I understood the previous week’s loss in the context of the poor technicals, I cannot point to anything for this week’s gain except that T2108 dropped below 40%. As a reminder, the S&P 500 has proven quite capable of strong bounces after T2108 drops below 40%. (On a sidenote, I ended up correctly caveating the T2108 Update from last Friday by saying the tenor of trading could change following the tragic terrorist attacks in Paris).
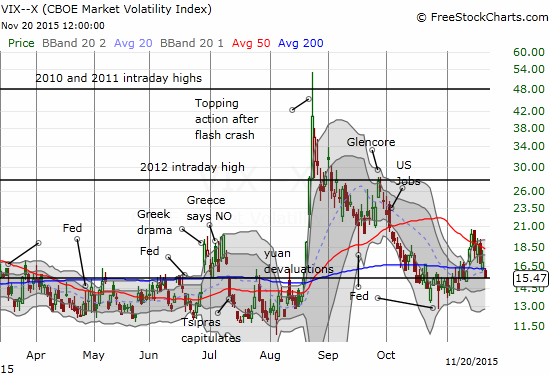
The volatility index, the VIX, dropped all week. It closed just above the 15.35 pivot. So, I am still clinging to my call options on ProShares Ultra VIX Short-Term Futures ETF (UVXY). If the VIX falls further, I will look to aggressively leverage these call options as hedges.
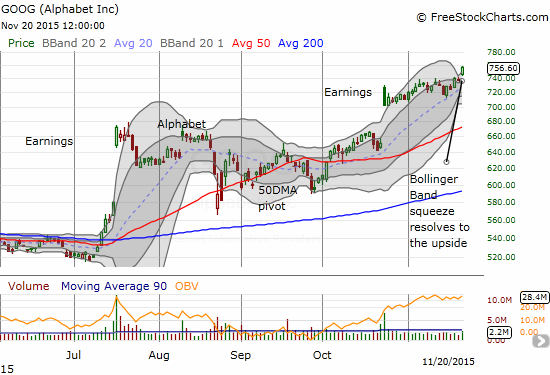
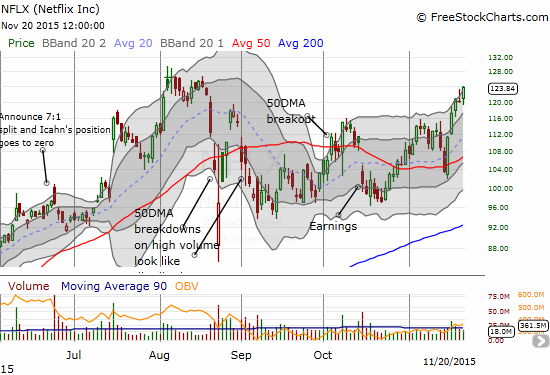
Two prime stocks on my radar are old favorites Netflix (NFLX) and Alphabet (GOOG). NFLX gained 19.5% for the week. GOOG gained 5.5% for the week for a fresh all-time high.
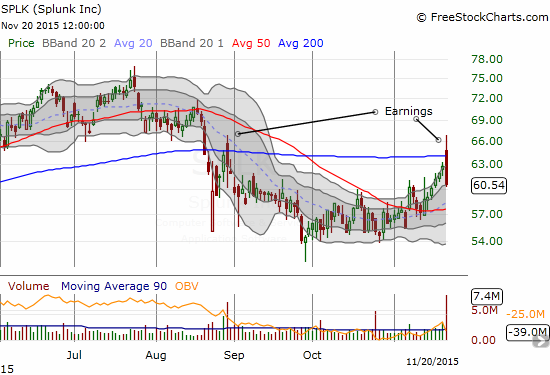
Splunk (SPLK) is a post-earnings shorting opportunity I completely missed. While I have not updated my skeptical piece from last year titled “Splunk: An Insider Bonanza,” I am as skeptical as ever. I have been waiting and waiting for a good entry point to initiate a fresh short position. I should have been on the ball to short SPLK as it gapped up and surged well over its upper-Bollinger Band (BB). I should have been doubly ready to go short as SPLK fell back below its 200DMA. The stock ended the day with a clear and strong bearish engulfing pattern (the open and close are higher and lower than the previous day’s high and low respectively). If the pattern from August earnings repeats, then the stock could continue to slide. The huge caveat of course is that slide occurred while the rest of the market was struggling.
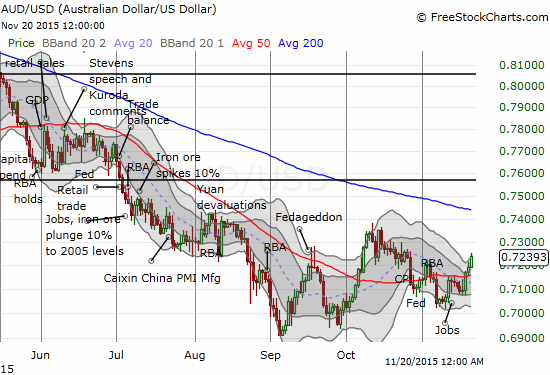
One of the big surprises for the week was the strength in the Australian dollar. This is another case of a drive lacking a firm catalyst. However, the rally is definitely consistent with the rally in the stock market. The irony of this pop is that iron ore sold off along with the rest of the commodity space this week. Iron ore ran smack into multi-year lows just above the levels hit in July. Chinese steel futures are hitting fresh record lows. Copper keeps crying out in pain. Within the next few weeks, I am likely going to add significantly to existing shorts on the Australian dollar. In other words, there is yet one more reason to be extremely wary of this rally even as I look to “chase” some of the hotter movers in case this “contrary” rally continues.
Daily T2108 vs the S&P 500
")
Black line: T2108 (measured on the right); Green line: S&P 500 (for comparative purposes)
Red line: T2108 Overbought (70%); Blue line: T2108 Oversold (20%)
Weekly T2108

*All charts created using freestockcharts.com unless otherwise stated
The charts above are the my LATEST updates independent of the date of this given T2108 post. For my latest T2108 post click here.
Related links:
The T2108 Resource Page
Expanded daily chart of T2108 versus the S&P 500
Expanded weekly chart of T2108
Be careful out there!
Full disclosure: short the Australian dollar, long UVXY call options