
(T2108 measures the percentage of stocks trading above their respective 40-day moving averages [DMAs]. It helps to identify extremes in market sentiment that are likely to reverse. To learn more about it, see my T2108 Resource Page. You can follow real-time T2108 commentary on twitter using the #T2108 hashtag. T2108-related trades and other trades are occasionally posted on twitter using the #120trade hashtag. T2107 measures the percentage of stocks trading above their respective 200DMAs)
T2108 Status: 65.4% (near 6-month high)
T2107 Status: 29.1%
VIX Status: 17.1
General (Short-term) Trading Call: Neutral (target of 1996 on the S&P 500 has already occurred ahead of overbought conditions. See “From the Edge of A Breakout to the Ledge of A Breakdown” for more details).
Active T2108 periods: Day #6 over 20%, Day #5 over 30%, Day #5 over 40%, Day #3 over 50%, Day #2 over 60%, Day #320 under 70%
Reference Charts (click for view of last 6 months from Stockcharts.com):
S&P 500 or SPY
SDS (ProShares UltraShort S&P500)
U.S. Dollar Index (volatility index)
EEM (iShares MSCI Emerging Markets)
VIX (volatility index)
VXX (iPath S&P 500 VIX Short-Term Futures ETN)
EWG (iShares MSCI Germany Index Fund)
CAT (Caterpillar).
IBB (iShares Nasdaq Biotechnology).
Commentary
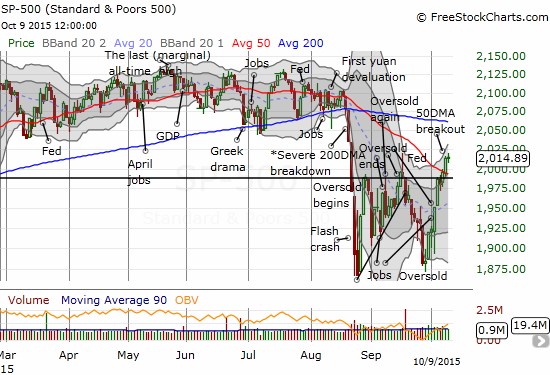
It was a close call. T2108 gained for the 9th straight trading day. My favorite technical indicator got as high as 67.6%, still short of overbought conditions. The S&P 500 (SPY) also closed with a very marginal gain, essentially flat. The index remains comfortably above its 50DMA. With the upper-Bollinger Bands (BBs) opening upward, a run-up to 200DMA resistance sometime in the coming weeks looks all the more likely. Still, I decided to lock in profits on my last play on the S&P 500 (SPY): shares in ProShares Ultra S&P500 (SSO).
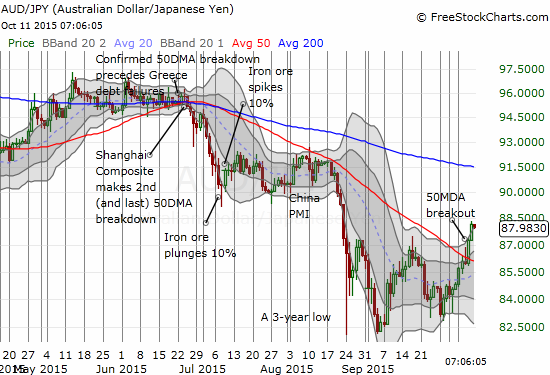
I am skipping to what I consider the biggest developing story from a technical and fundamental standpoint: a looming breakdown for the U.S. dollar index (UUP). At the same time, commodity currencies are soaring. These moves are the surest signs that risk-aversion is fading into the rear-view mirror and market sentiment is steadily improving.
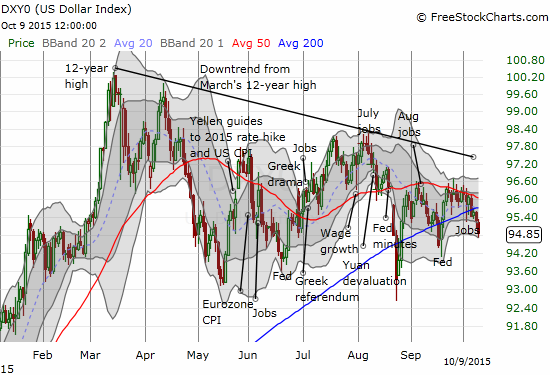
While I am very skeptical of the durability and sustainability of the run-up in commodity-related currencies, I am more and more interested in the potential for the U.S. dollar to break down. Ever since its 12-year peak in March, the index has slowly but surely taken on a downtrend. It is definitely not the unstoppable dollar of before. In a previous post, I argued that the U.S. dollar will remain trapped in a trading range. NOW, I have to wonder whether a real downtrend is looming.
Basically, the pushout of the odds for a rate hike is producing this opportunity for traders to behave as if they have a green light to do the contrarian commodity-related trade. I have stopped adding to my fades on this move, but I am poised to get back into it if (when?) weakness shows up again.
There are two stock charts I missed in the last T2108 Update that are of great interest: Baidu (BIDU) and Tesla (TSLA).
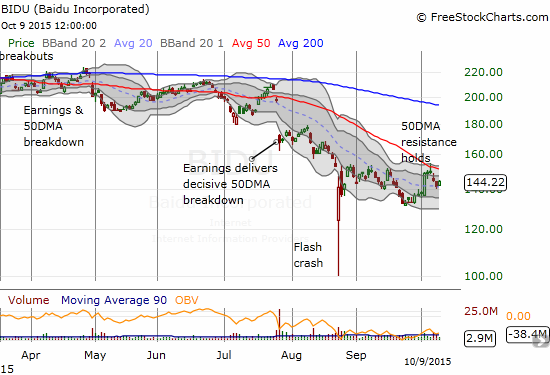
BIDU has been in decline ever since it gapped down on a 50DMA failure after April earnings. The second attempt at a recovery was marred by an even more disastrous post-earnings performance in July. After a meager recovery failed, I officially dropped BIDU from my list of stocks to trade aggressively to the long side. If I were a bear at the time, BIDU would have been a top stock to short. Because I dropped BIDU from my list, I was not prepared to rush in and buy some shares during the flash crash in August. Last week’s 50DMA failure solidified the bearish bias on this former titan.
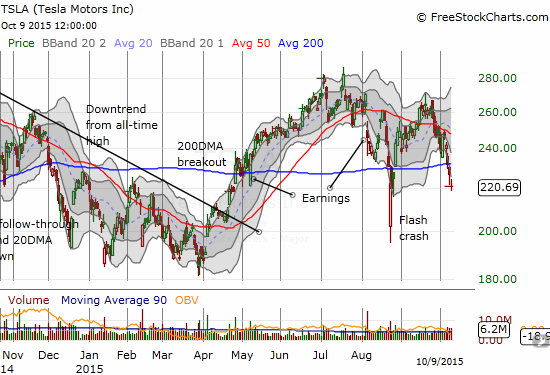
Tesla (TSLA) often acts like Teflon: bad news just bounces off the stock and recoveries from tumbles have been inevitable. Something has subtly changed since TSLA gapped below 50DMA support after August earnings – the stock is acting with more and more of a bearish bias. It is hard to see because the stock managed to break out above 50DMA support in September. However, note carefully that TSLA just barely closed the post-earnings gap and then stalled. Now, the stock has broken down below the even more critical 200DMA support again. And again, trading volume is higher than normal. This is a potentially important change in sentiment on the stock. I am not likely to make any trades on the stock anytime soon, but I am watching with greater interest.
Daily T2108 vs the S&P 500
")
Black line: T2108 (measured on the right); Green line: S&P 500 (for comparative purposes)
Red line: T2108 Overbought (70%); Blue line: T2108 Oversold (20%)
Weekly T2108

*All charts created using freestockcharts.com unless otherwise stated
The charts above are the my LATEST updates independent of the date of this given T2108 post. For my latest T2108 post click here.
Related links:
The T2108 Resource Page
Expanded daily chart of T2108 versus the S&P 500
Expanded weekly chart of T2108
Be careful out there!
Full disclosure: long SVXY shares, short AUD/JPY, net long U.S. dollar, long GLD