
(T2108 measures the percentage of stocks trading above their respective 40-day moving averages [DMAs]. It helps to identify extremes in market sentiment that are likely to reverse. To learn more about it, see my T2108 Resource Page. You can follow real-time T2108 commentary on twitter using the #T2108 hashtag. T2108-related trades and other trades are occasionally posted on twitter using the #120trade hashtag. T2107 measures the percentage of stocks trading above their respective 200DMAs)
T2108 Status: 65.0% (near 6-month high)
T2107 Status: 29.4% (6-week high)
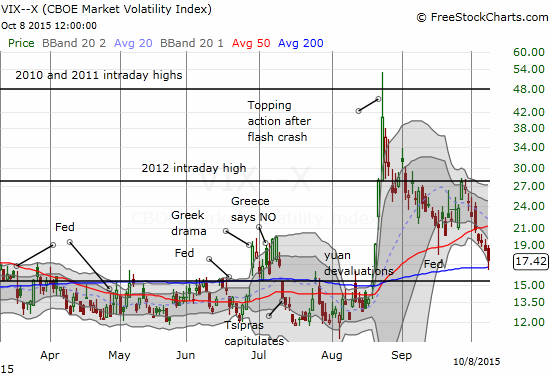
VIX Status: 17.4
General (Short-term) Trading Call: Neutral (target of 1996 on the S&P 500 has already occurred ahead of overbought conditions. See “From the Edge of A Breakout to the Ledge of A Breakdown” for more details).
Active T2108 periods: Day #5 over 20%, Day #4 over 30%, Day #4 over 40%, Day #2 over 50%, Day #1 over 60% (ending 113 days under 60%), Day #319 under 70%
Reference Charts (click for view of last 6 months from Stockcharts.com):
S&P 500 or SPY
SDS (ProShares UltraShort S&P500)
U.S. Dollar Index (volatility index)
EEM (iShares MSCI Emerging Markets)
VIX (volatility index)
VXX (iPath S&P 500 VIX Short-Term Futures ETN)
EWG (iShares MSCI Germany Index Fund)
CAT (Caterpillar).
IBB (iShares Nasdaq Biotechnology).
Commentary
The bullish tidings continue.
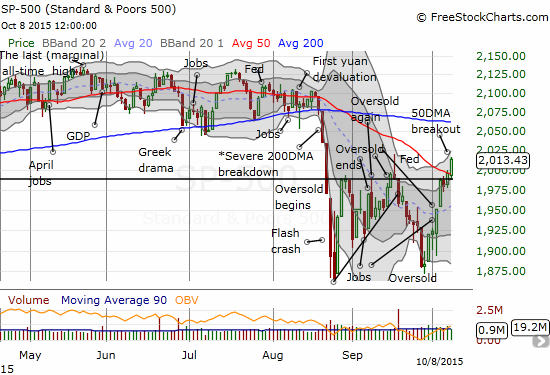
T2108 continued its startlingly fast run-up toward overbought conditions with a close at 65.0%. T2108 is on pace to hit overbought conditions on Friday, October 9, 2015. If not then, next week looks like a slam dunk. T2108 was last at current levels when the S&P 500 (SPY) was still making new all-time highs back in April. Today, Thursday, the S&P 500 managed to push through resistance at its 50DMA and is challenging the intraday high from September. This high neatly divided two oversold periods.
At its lows, the volatility index, the VIX, finally erased all the angst that began in August. I will wait until it touches the 15.35 pivot point before “declaring” another victory for fading volatility.
Trading from here is more difficult because the S&P 500 has a lot of resistance to fight. It cleared the 50DMA with no problem. By the time the index hits its 200DMA, T2108 will certainly be knee-deep in overbought conditions. That milestone will be a signal for shorting, perhaps aggressively depending on other technical conditions, like how the market responds to earnings season. If the S&P 500 manages to even break through 200DMA resistance while overbought, then it will be time to assess the prospects for one of those overbought run-up rallies. One step at a time of course.
In the meantime, the 50DMA breakout essentially confirms the W-like bottom I pointed out in the last T2108 Update. Even if the W-bottom eventually gives way, it should take a lot of time to do. Moreover, the trading environment will likely need to uncover a brand new source of angst (seems like the drama at commodities giant Glencore is already forgotten, so perhaps some financial messiness from there could still spark trouble in another few months).
So, the trading call stays at neutral with bullish and bearish bets getting fair consideration. Note well: given the strong upward press, the bulls and buyers sure seem to have taken full control back from sellers and bears.
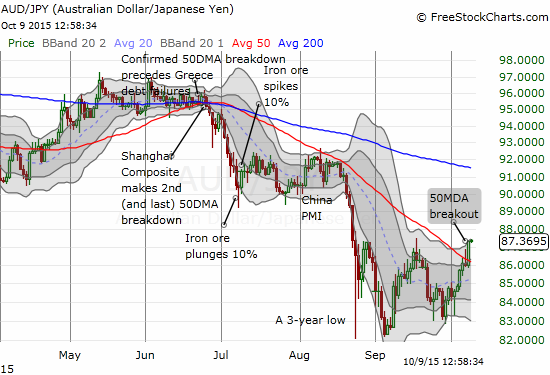
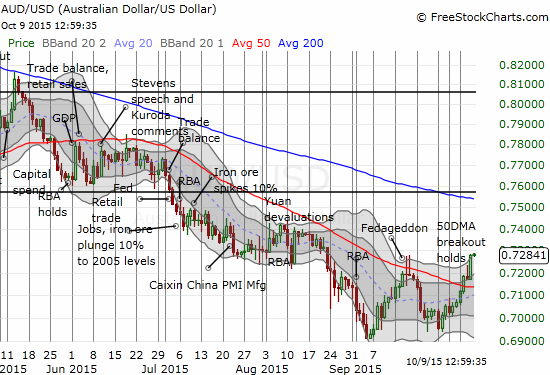
How about caveats? On Wednesday, I noted a stall in Caterpillar (CAT). CAT already seems ready to bounce back. Ditto for the Australian dollar (FXA) which is pressing upward and onward against all major currencies. This is a strong comeback for risk-taking. At the time of writing, the Australian dollar is breaking out against both the Japanese yen (FXY) and the U.S. dollar (UUP). I have put on hold further accumulation of my bets against the Australian dollar and am starting to wrap my head around the potential BULLISH implications of this on-going rally.
With those major caveats on hold for now, I noticed caveats in the form of laggards in big-cap tech.
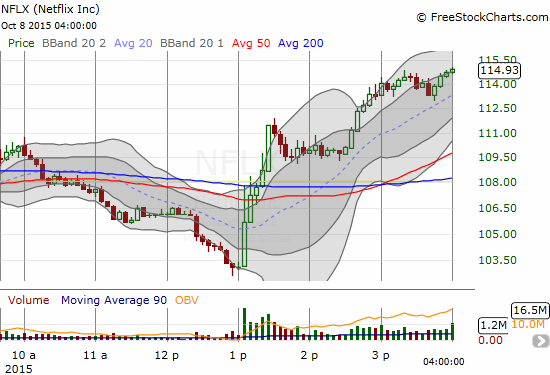
First, Netflix (NFLX) was down 3% at one point during the day. It looked like a sure 50DMA breakdown…
$NFLX failed to hold 50DMA. S&P 500 struggling at its 50DMA. $IBB below $300 again. But #VIX is flatline…
— Duru A (@DrDuru) Oct. 8 at 09:54 AM
Then, suddenly, NFLX soared vertically and closed the day not only above its 50DMA but well above its upper-Bollinger Band (BB)! I cannot even remember the last time I saw something like this in a large stock. The only news out on the day was a $1 price increase for a Netflix subscription. I could not find a related NFLX press release but this ABC news article suffices: “Netflix Raising US Price for Most Popular Video Plan by $1”
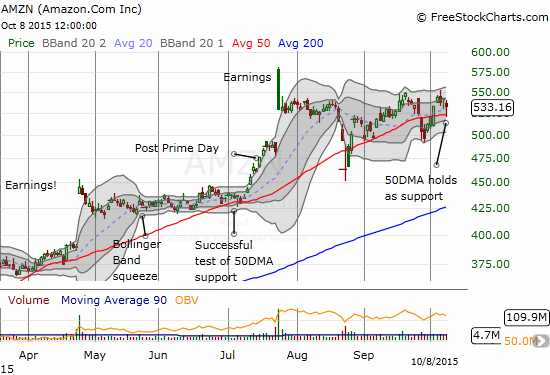
While I did not participate in any of the NFLX action, I DID quickly flip Amazon.com (AMZN) call options on the day (I am still very bullish on AMZN trades).
Woah. What a flip for $NFLX. What big cap is next? $AMZN?
— Duru A (@DrDuru) Oct. 8 at 10:25 AM
Not much of a caveat of course, especially since NFLX’s move now forces me back into the bullish camp on the stock. My lone caveat on the day comes from Apple (AAPL). The stock tried to come back but fell short.
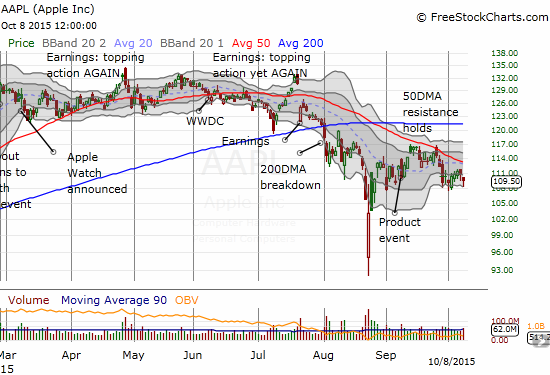
The AAPL caveat is not just about the negative close. It is even more about AAPL’s languishing behavior. The stock failed twice last month to break though 50DMA resistance and end the downtrend from its previous all-time high. Such a move would have lead the market. Instead, AAPL is lagging. It is hard to imagine the market leaving AAPL too far behind, so the current divergence is interesting to watch.
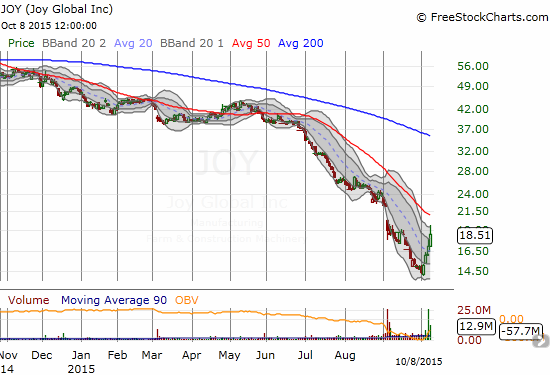
Finally, the major risk-on move underway is delivering large gains to many beaten up stocks. This alone could be a caveat as I strongly suspect stocks like Joy Global (JOY) are catching bids as “catch-up” stocks.
$JOY up 34% from last week's 11-year low. Great example of current rush into beaten up stocks. Late buyers trying to play "catch up."
— Duru A (@DrDuru) Oct. 8 at 12:26 PM
I should have loaded up on more of these kinds of plays during the oversold period. “Cheap” is good for playing catch-up, especially when sellers have apparently exhausted themselves. At that point, the stock can only go up. These kinds of plays are not for the faint of heart and require a lot of patience and diligence to avoid
chasing just as the buying fervor turns into a rush to lock in juicy profits.
Daily T2108 vs the S&P 500
")
Black line: T2108 (measured on the right); Green line: S&P 500 (for comparative purposes)
Red line: T2108 Overbought (70%); Blue line: T2108 Oversold (20%)
Weekly T2108

*All charts created using freestockcharts.com unless otherwise stated
The charts above are the my LATEST updates independent of the date of this given T2108 post. For my latest T2108 post click here.
Related links:
The T2108 Resource Page
Expanded daily chart of T2108 versus the S&P 500
Expanded weekly chart of T2108
Be careful out there!
Full disclosure: long SVXY shares, long SSO shares, short CAT, short AUD/JPY, net long U.S. dollar